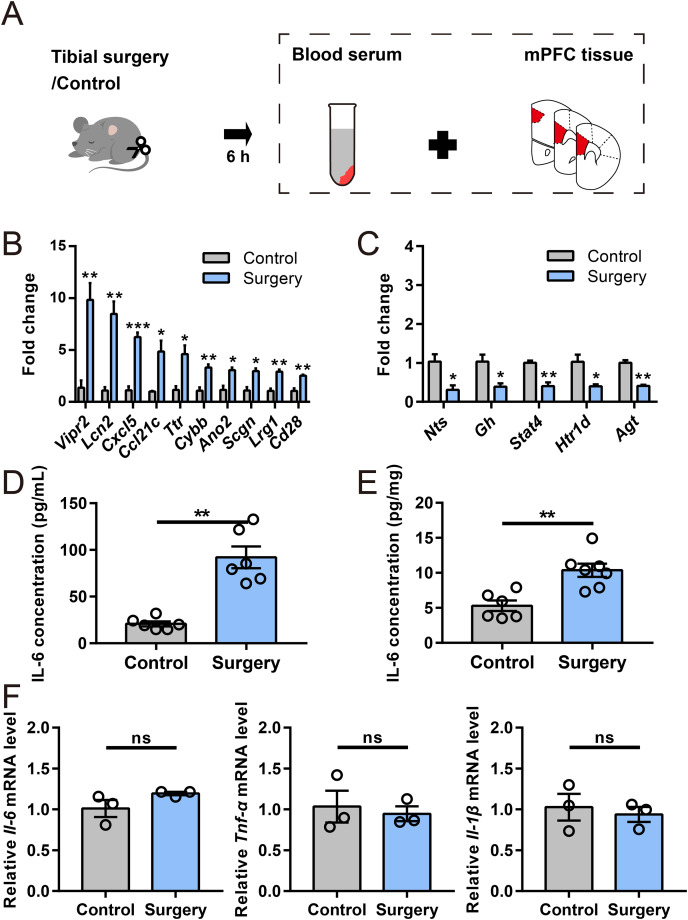
Figure 4. Verification of DEGs and inflammatory cytokine levels.
(A) Cartoon depicting samples collection in another cohort at 6 h after surgery. (B and C) qRT–PCR validation of selected DEGs identified by RNA-seq analysis (n = 3 mice/group). (D and E) ELISA for IL-6 in serum and the mPFC, respectively (n = 6–7 mice/group). (F) Relative expression of Il-6, Tnf-α, and Il-1β in the mPFC (n = 3 mice/group). Data are represented as mean ± SEM, ***P < 0.001; **P < 0.01; *P < 0.05; ns, not significant.

