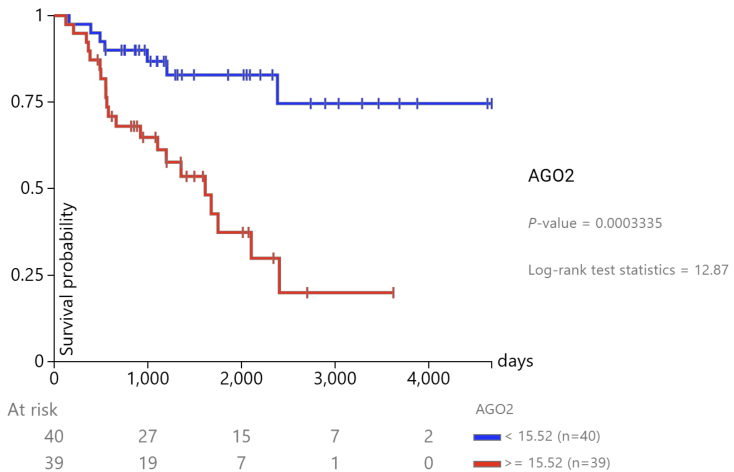
Figure 3.
Kaplan‒Meier gene expression analysis of AGO2-ACC-TCGA. Kaplan‒Meier curves comparing survival between ACC patients with low (< 15.52, blue) and high (≥ 15.52, red) AGO2 expression in the TCGA cohort. The difference in survival was statistically significant (P = 0.0003335, log-rank test statistic = 12.87), indicating a prognostic impact of AGO2 expression on patient outcome.

 This work is licensed under a