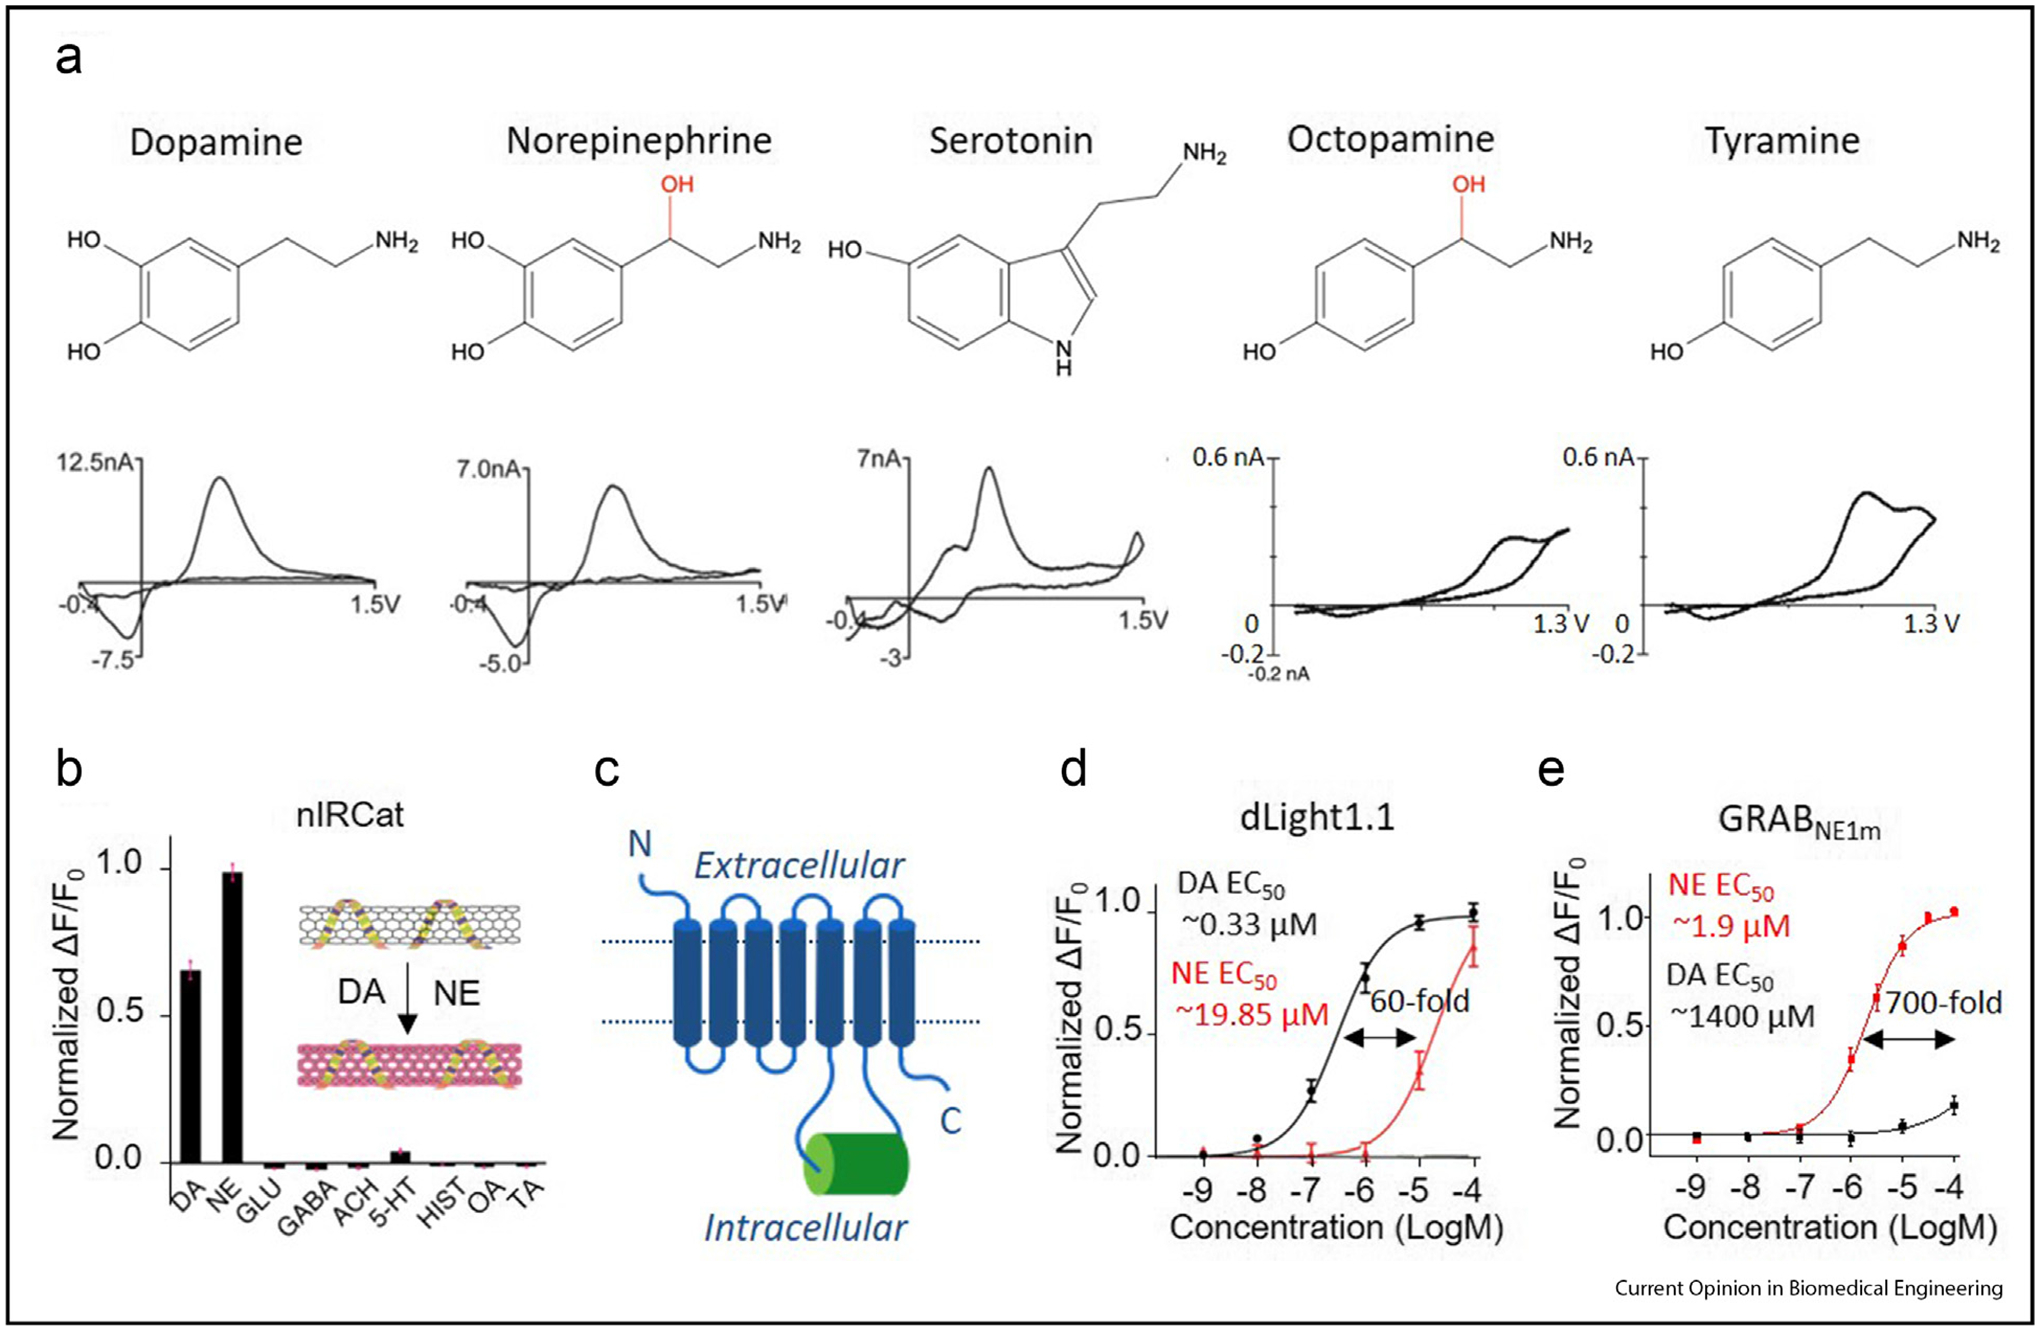
Figure 1.

Distinguishing monoamine neuromodulators using fast-scan cyclic voltammetry (FSCV) and GPCR-based single-fluorophore sensors (a) The chemical structures (top) and corresponding FSCV voltammogram traces (bottom) of the indicated monoamines [27,57]. The hydroxyl group that differs between DA and NE and between OA and TA is shown in red (b) Schematic diagram of carbon nanoparticle–based catecholamine sensor nIRCat and its normalized response to 100 mM DA, NE, GLU, GABA, acetylcholine (ACH), 5-HT, histamine (HIST), OA and TA [11] (c) Schematic diagram of a generic GPCR-based single-fluorophore sensor; the fluorophore is inserted in the third intracellular loop and is shown in green (d and e) Dose–response curves for the dLight1.1 expressed in HEK293T cells [9] and GRABNE1m expressed in cultured cortical neurons [8] in response to DA and NE; the difference in EC50 between DA and NE is also shown for each sensor. (Figures are modified from original research paper with permission from the publisher).
