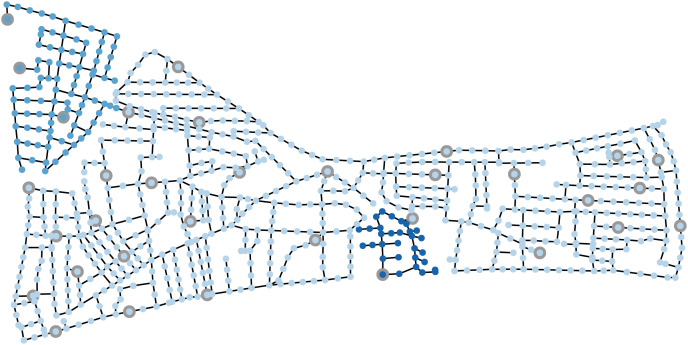
Figure 3. The L-Town WDS, its sensor nodes and the protected groups, each highlighted in another color (group 1, also called area C, on the top left in middle shade; group 2, also called area A, in light shade; group 3, also called area B, on the bottom in the middle in dark shade).
The sensor nodes are colored in the same color as the protected group to which they belong and highlighted with a grey circle.

