. 2024 Dec 6;132(12):127002. doi: 10.1289/EHP14585

Figure 1.

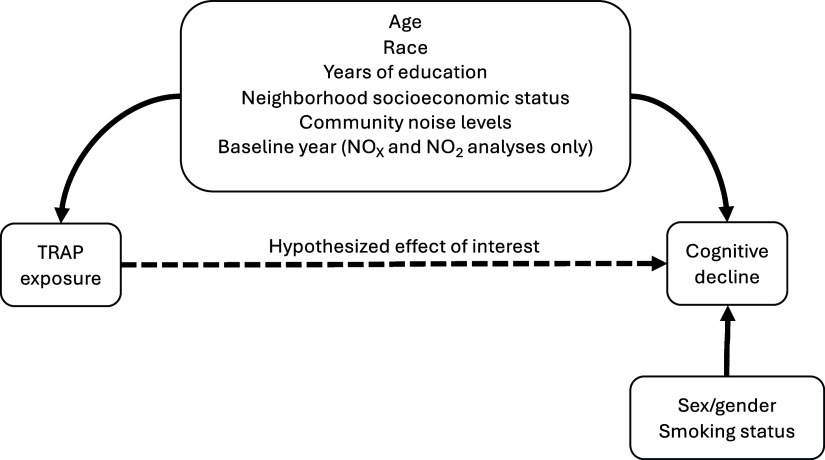
Figure 1 is a directed acyclic graph. The graph shows that traffic-related air pollution is hypothesized to affect cognitive decline. The graph also shows that age, race, years of education, neighborhood socioeconomic status, community noise levels, and baseline year (oxides of nitrogen and nitrogen dioxide only) are assumed to confound the relationship between exposure to traffic-related air pollution and cognitive decline. In addition, the graph shows that sex or gender, plus smoking status, are hypothesized to be precision variables that affect cognitive decline, but not traffice-related air pollution exposure.

Directed acyclic graph describing the assumed relationships between TRAP exposure, cognitive decline, and the covariates included in our primary outcome models. Note: TRAP, traffic-related air pollution.