. 2024 Dec 6;132(12):127002. doi: 10.1289/EHP14585

Figure 3.

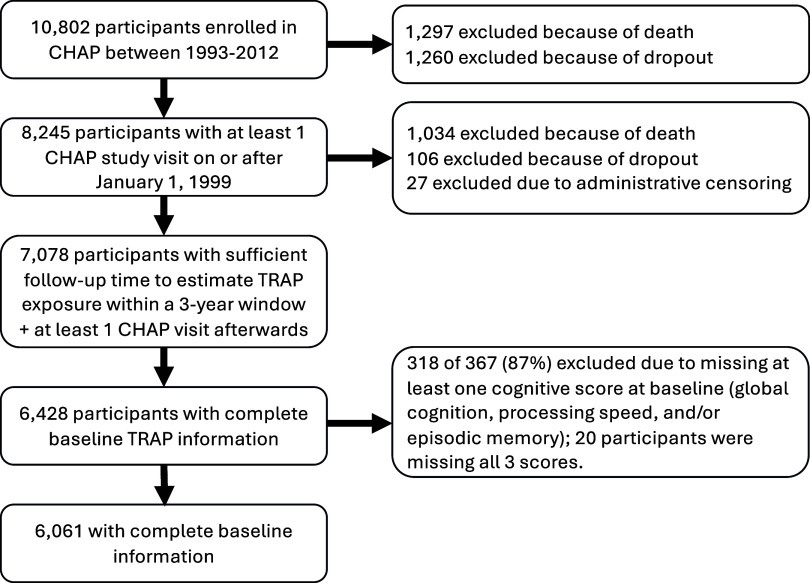
Figure 3 is a flowchart with four steps. Step 1: Between 1993 and 2012, there were 10802 participants registered in the Chicago Health and Aging Project, with the exception of 1297 who died and 1260 who dropped out. Step 2: There are 8245 participants who have had at least one Chicago Health and Aging Project study visit on or after January 1, 1999, removing 1034 participants who died, 106 participants who dropped out, and 27 who were eliminated due to administrative censoring. Step 3: There are 7078 participants with enough follow-up time to assess traffic-related air pollution exposure throughout a three-year period, plus at least one Chicago Health and Aging Project visit afterward. Step 4: There are 6428 participants with complete baseline traffic-related air pollution information, with 318 of 367 (87 percent) excluded because they lacked at least one cognitive score at baseline (global cognition, processing speed, or episodic memory); 20 participants lacked all three. Step 5: There is 6061 with complete baseline data.

Flowchart describing the creation of our analytic dataset based on participants who enrolled in the Chicago Health and Aging Project between 1993 and 2012.