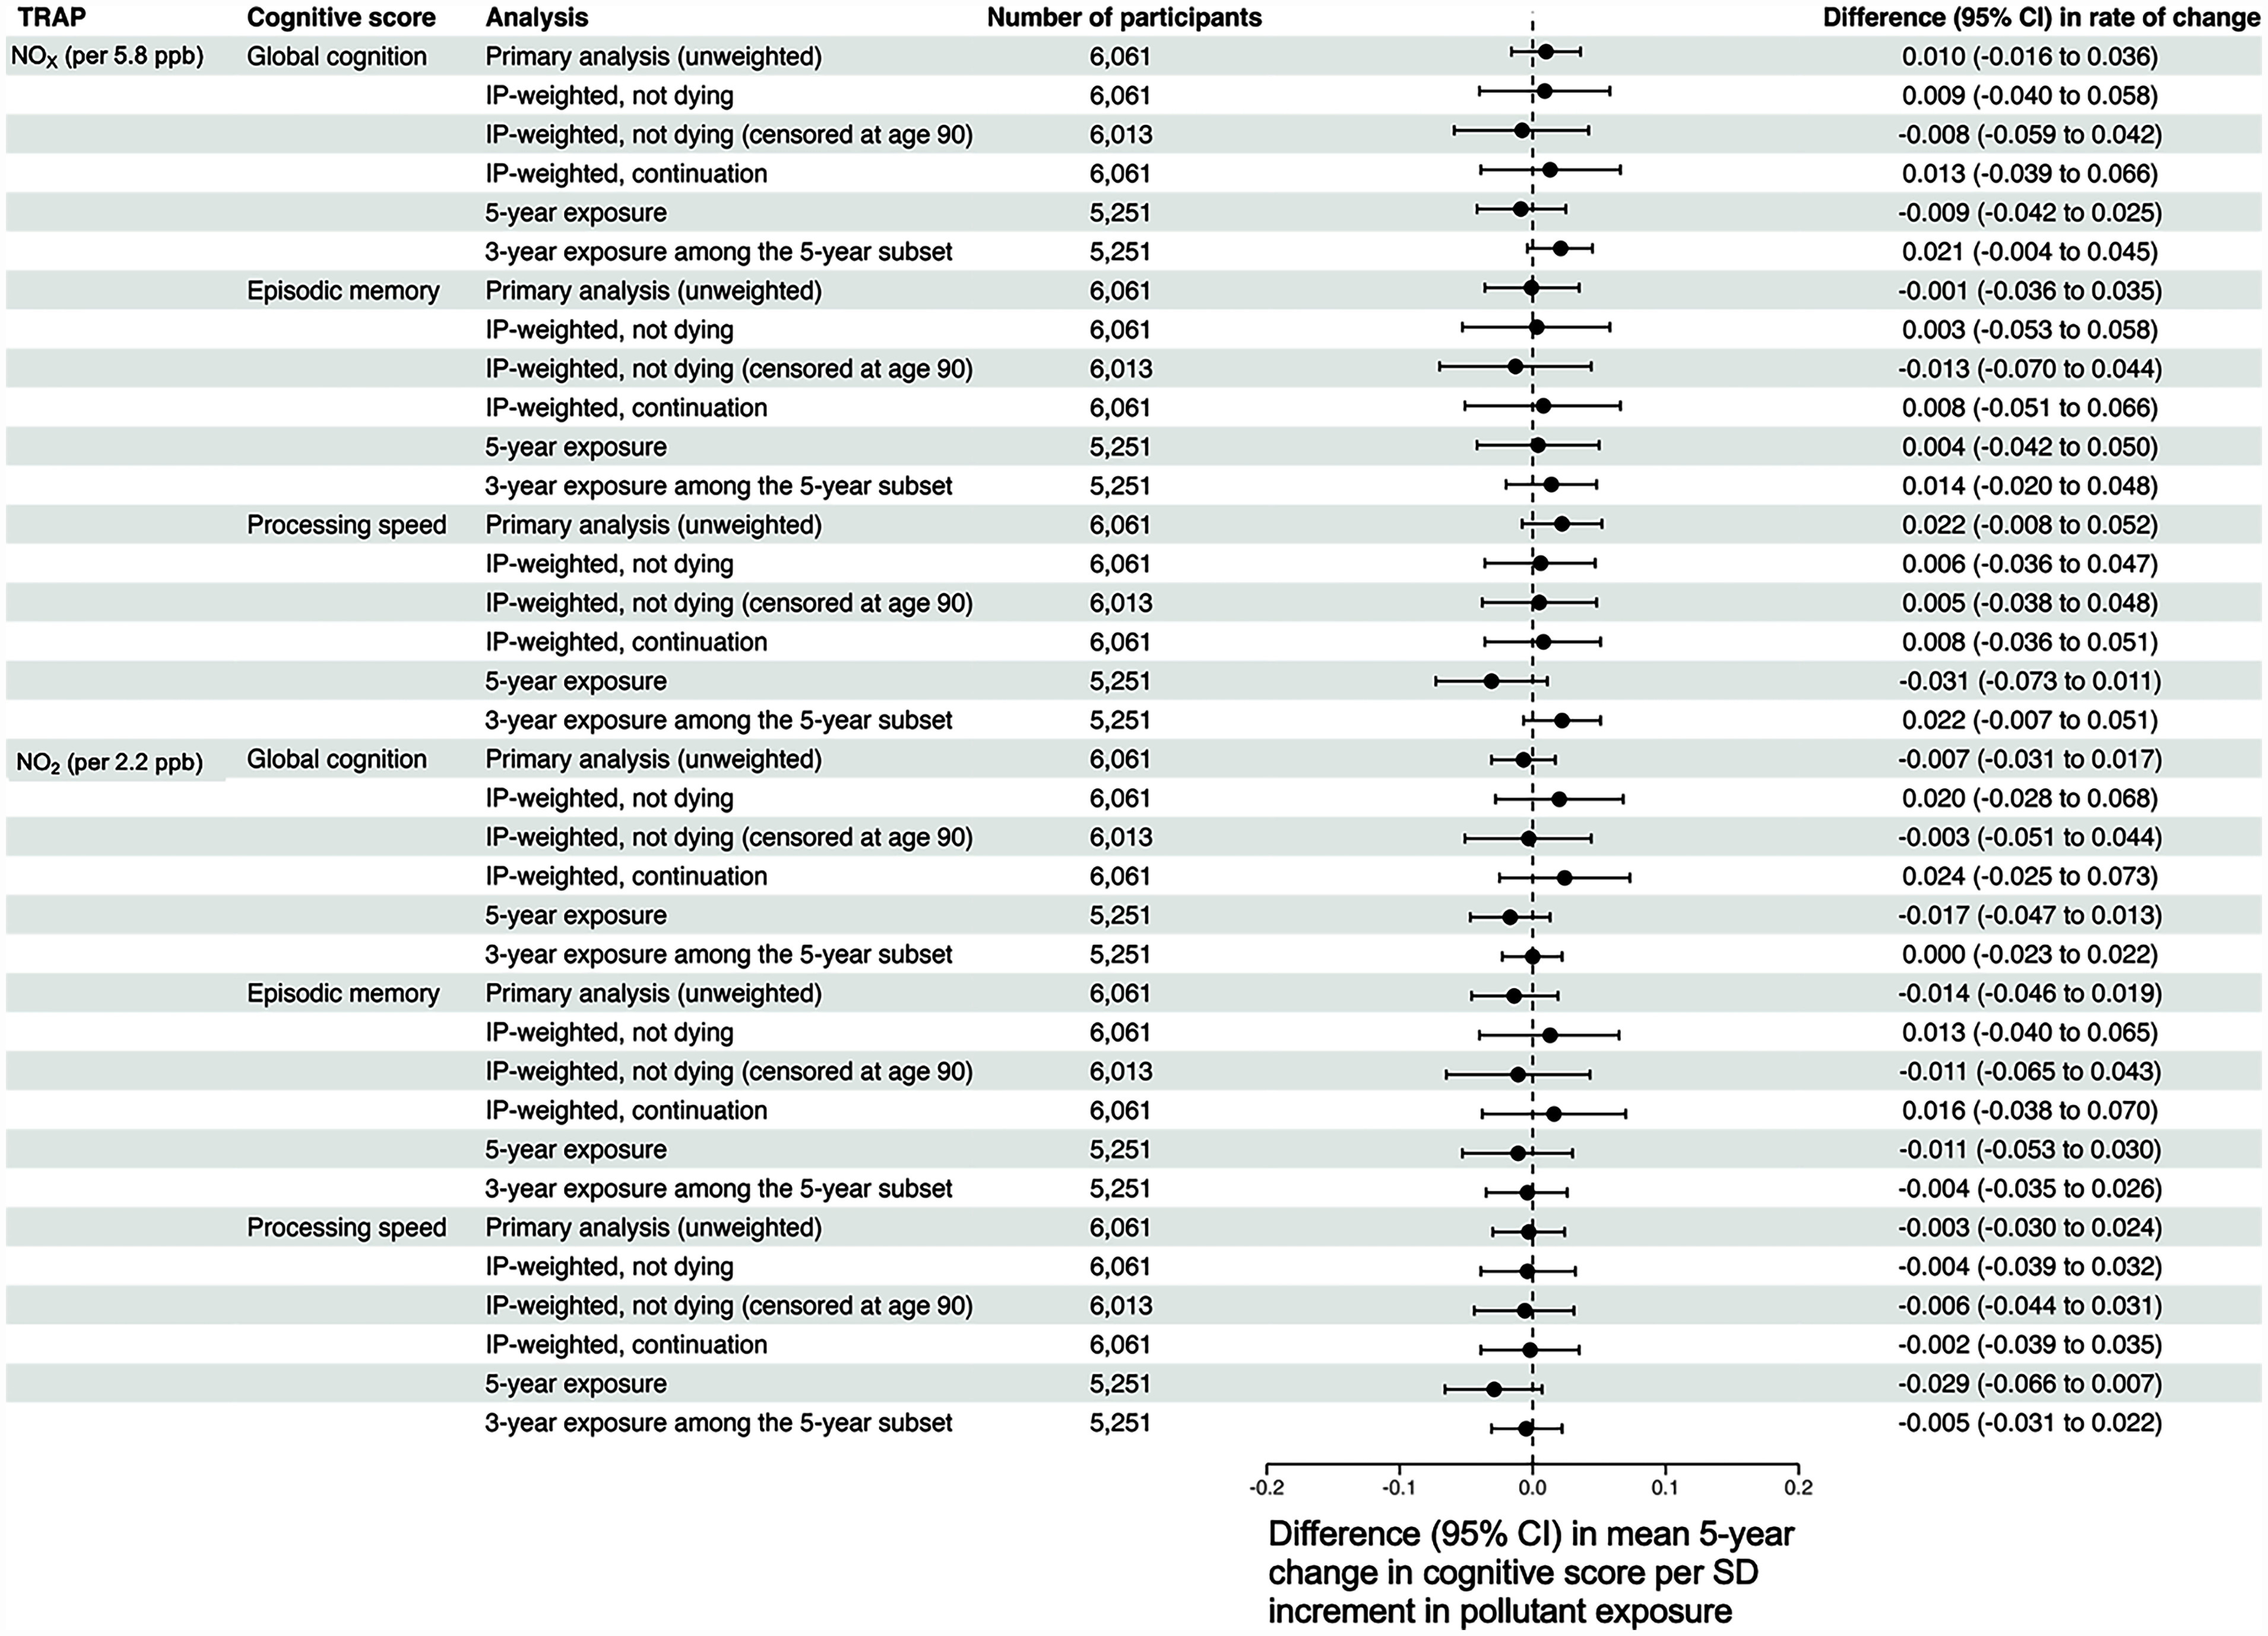
Figure 5.

Adjusted differences in the mean 5-y rate of change in global cognition, processing speed, and episodic memory per 1-standard deviation increment in tailpipe-related traffic-related air pollution exposure, estimated from sensitivity analyses. Note: All models adjusted for baseline age, sex, race, study time, educational attainment, smoking status, community noise level, neighborhood socioeconomic status, calendar year of the baseline visit, and cross-products between these variables and study time. In addition, although the CHAP collected data on its participants from 1993 to 2012, model-based predicted values for and were available for 2009 only. To partially address this misalignment of exposure and outcome ascertainment, we used the procedure described in the main text to assign 3-y TRAP exposures to each participant in our analytic sample. To explore the impact of potential post-enrollment selection biases and our choice of a 3-y exposure window, we conducted the following sensitivity analyses: a) incorporating stabilized inverse probability of continuation due to not dying weights into our outcome models; b) incorporating stabilized inverse probability of continuation due to not dying weights into our outcome models, censoring follow-up time once a participant became at least 90 y of age; c) incorporating stabilized inverse probability of continuation weights, which were defined as the product of the inverse probability of continuation due to not dying and the inverse probability of continuation due to not dropping out of the study; d) restricting to those eligible for a 5-y exposure window [i.e., those who had at least one CHAP visit 5 y after their working start date described in the main text, and estimating 5-y and 3-y TRAP exposure among those eligible for 5-y exposure windows (“5-year exposure” and “3-year exposure among the 5-year exposure subset,” respectively)]. For all sensitivity analyses, we assumed as with our primary analyses that 2009 predicted and concentrations reflect, at least in rank ordering, what would have been observed for each CHAP participant at their analytic baseline visit. CHAP, Chicago Health and Aging Project; PM, particulate matter; TRAP, traffic-related air pollution.
