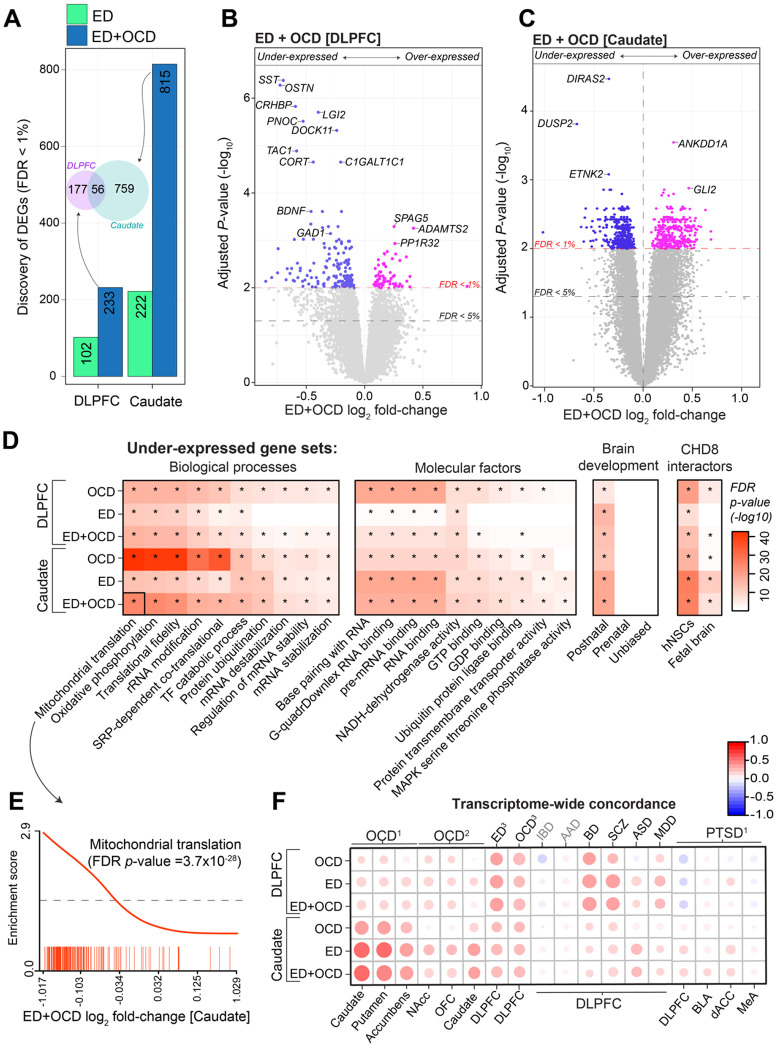
Figure 2. Integrated Analysis of Gene Expression in ED and OCD.
(A) Differential Gene Count: The bar graph displays the count of differentially expressed genes (DEGs) with False Discovery Rate (FDR) < 1% on the y-axis, contrasting controls against cases of ED alone and the combination of ED with OCD (ED+OCD) across both brain regions shown on the x-axis. An inset Venn diagram illustrates the significant ED+OCD DEG overlap between the regions. (B-C) Volcano Plots for Combined Analysis: Displaying the significance (−log10 FDR p-value; y-axis) versus magnitude of expression change (log2 fold-change; x-axis) for ED+OCD DEGs in the DLPFC (B) and caudate (C). (D) Gene-Set Enrichment Analysis (CAMERA): Heatmap showing gene-set enrichment analysis outcomes for genes under-expressed in OCD, ED, and ED+OCD within the caudate and DLPFC (y-axis), with FDR-adjusted p-values for each gene set. Notably enriched categories include mitochondrial translation, oxidative phosphorylation, mRNA stability, genes with postnatal expression bias, and CHD8 interacting proteins. Minimal to no enrichment is observed for over-expressed genes. (E) CAMERA Enrichment Barcode Plot: An example barcode plot highlights gene-set enrichment for mitochondrial translation on the y-axis, plotted against a rank of ED+OCD-related genes sorted by log2 fold-change on the x-axis. This example corresponds to the black-outlined section of the heatmap in panel D. (F) Transcriptome-wide Concordance: A scatter plot compares transcriptome-wide gene-level effect sizes for OCD, ED, and ED+OCD alterations against those derived from independent brain transcriptome studies (y-axis), demonstrating high correlations, particularly with independent studies of OCD. References: OCD1 (Lisboa et al., 2019), OCD2 (Piantadosi et al., 2021), ED3OCD3 (Jaffe et al., 2014) and PTSD1 (Jaffe et al., 2022).

