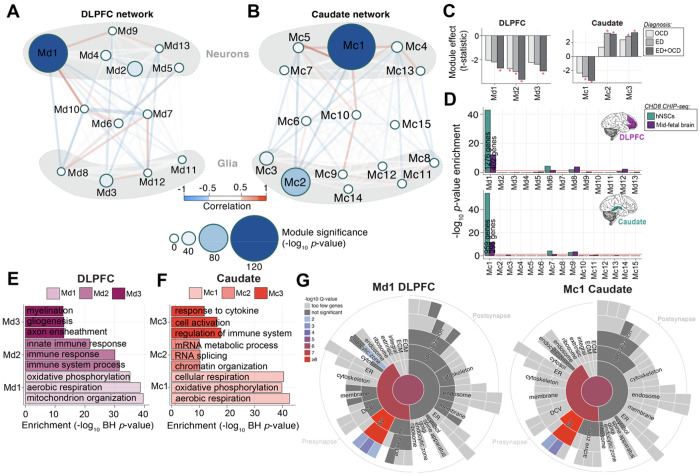
Figure 4. Network analysis identifies modules of co-expressed genes across ED and OCD.
(A-B) Module Relationships and Cell Type Clustering: Network diagrams illustrate the relationships between gene co-expression modules in the DLPFC (A) and caudate (B), with module size representing the −log10 p-value significance of ED+OCD DEG enrichment in each region. (C) Module-Level Differential Expression: Bar graphs depict t-statistics from a moderated t-test model, indicating module eigengene association with disease status (FDR-corrected *P<0.05). (D) CHD8 Interacting Proteins Module Enrichment: Enrichment levels (−log10 p-value, Fisher’s Exact Test) for CHD8 interacting proteins across modules are shown for human neural stem cells (hNSCs) and human mid-fetal brain tissue, with separate analyses for DLPFC modules (top) and caudate modules (bottom). (E-F) Functional Enrichment of Top Modules: The functional enrichment (−log10 Benjamini-Hochberg adjusted P-value; x-axis) for the top three co-expression modules is compared in the DLPFC (E) and caudate (F). (G) SynGO Sunburst Plots for Synaptic Gene-Set Enrichment: Sunburst plots from SynGO analysis depict the synaptic gene-set enrichment for genes within the most significant modules, Md1 in the DLPFC (left) and Mc1 in the caudate (right).

