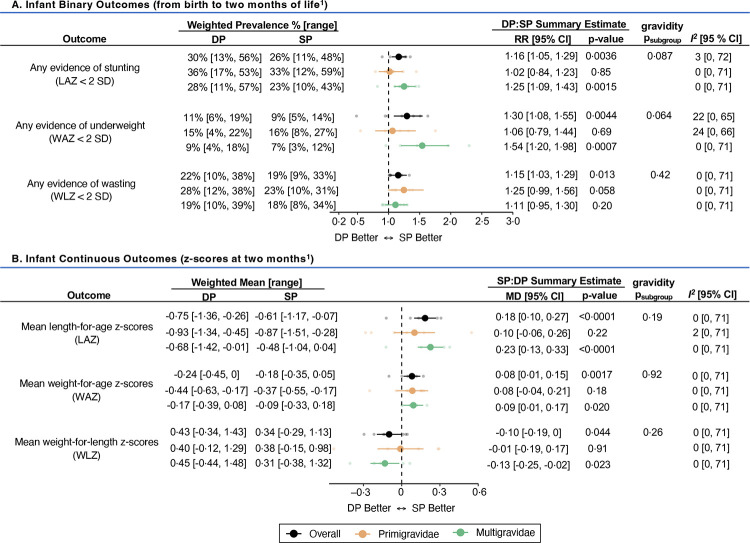
Figure 5. Forest plot comparing binary (A) and continuous (B) infant outcomes between IPTp regimens.
All estimates reflect unadjusted differences between arms. Weighted prevalence and means for each outcome were calculated using a restricted maximum likelihood random-effects model.
Abbreviations: CI=confidence interval; DP=dihydroartemisinin-piperaquine; LAZ=length-for-age z-score; RR = relative risk ratio; SP=sulfadoxine-pyrimethamine; WAZ=weight-for-age z-score; WLZ=weight-for-length z-score
1 Summary estimates derived from seven of eight studies (except the Mlugu 2021 study which did not collect infant follow-up data)

