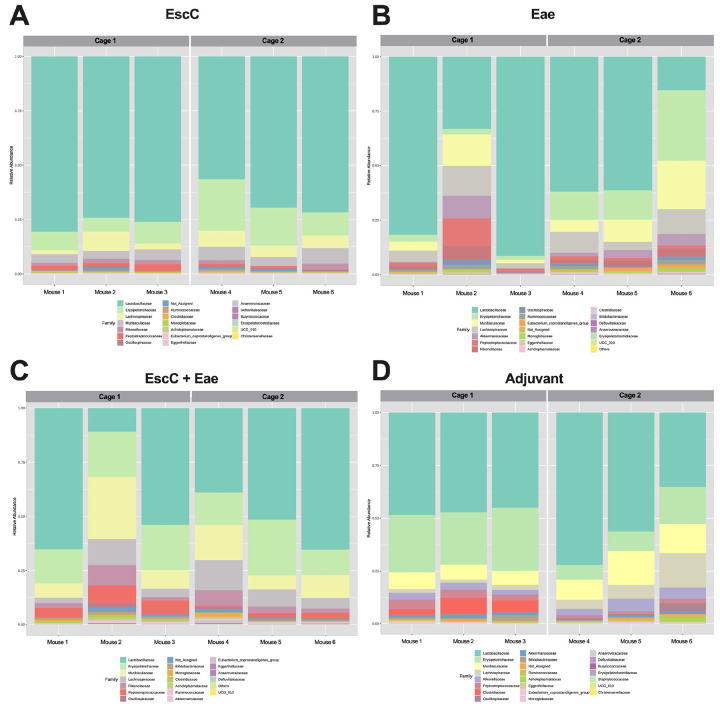
Figure 2. Fecal microbiome compositions of individual mice treated with AuNP vaccine formulations.
Relative abundances at the family level in (A) AuNP-EscC, (B) AuNP-Eae, (C) EscC+Eae, and (D) adjuvant-only vaccinated animals. Each chart displays a comparison between Cage 1 and Cage 2 (each housing 3 mice) within each treatment group.

