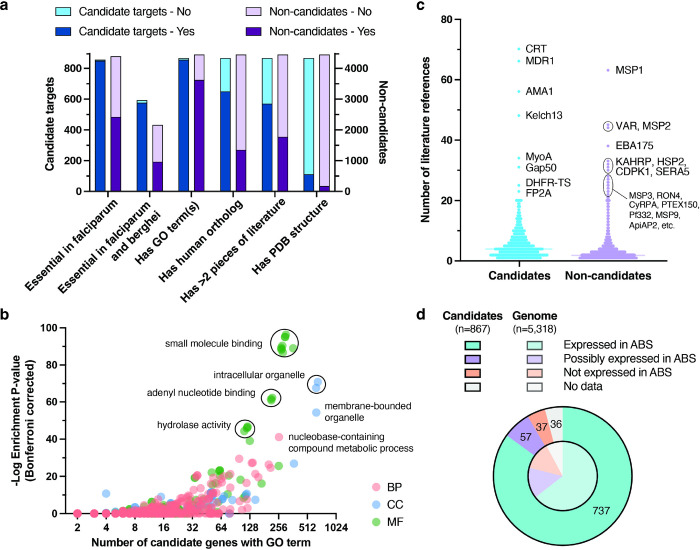
Figure 2. Characteristics of 867 candidate targets compared to 4,451 non-candidate genes.
a) Characteristics of candidate targets vs. non-candidates. Comparison of characteristics between the 867 candidates (blue) and 4,451 non-candidates (purple). Numbers of candidate targets vs non-candidates labelled essential only in the P. falciparum essentiality screen and not the P. berghei datasets (850 vs. 2,421); labelled essential in both P. falciparum and berghei datasets (577 vs. 967); having at least one GO term (857 vs. 3,624); having human ortholog(s) (650 vs 1,356); having >2 associated literature references (570 vs 1,775); or having PDB structures (112 vs 174) are shown. b) Gene ontology (GO) term enrichment analysis for the 867 candidates. GO term enrichment analysis for the 867 candidate targets compared to all 5,318 protein coding genes in the P. falciparum 3D7 genome using GOATOOLS85. Terms with ontology tree depth > 2 (n = 939) are displayed based on number of candidates having the GO term (X-axis) versus −log10 Bonferroni corrected enrichment P value, with a maximum uncorrected P-value of 0.05 (Y-axis, Fisher’s exact test). Points corresponding to GO terms are colored by ontology type: red for biological process (BP), blue for cellular component (CC), and green for molecular function (MF). Highly enriched terms or groups of terms are labelled with shared descriptors. c) Scientific literature references for candidates vs. non-candidates. Distributions of number of unique scientific publications associated with the 867 candidate targets (blue) vs. 4,451 non-candidate genes (purple). Median lines are shown for both groups, and the most highly referenced genes are labelled. d) Gene expression in the asexual blood stage (ABS) compared to all protein-coding genes. Distribution of classifications for evidence of gene expression in the asexual blood stage (ring, trophozoite, or schizont) according to Le Roch et al. data41. Candidate targets with clear evidence of ABS expression (737, teal), unclear evidence (57, purple), no expression (37, orange) and no data (36, grey) are shown in the outer pie, in contrast to the distribution among all P. falciparum protein-coding genes in the inner pie.

