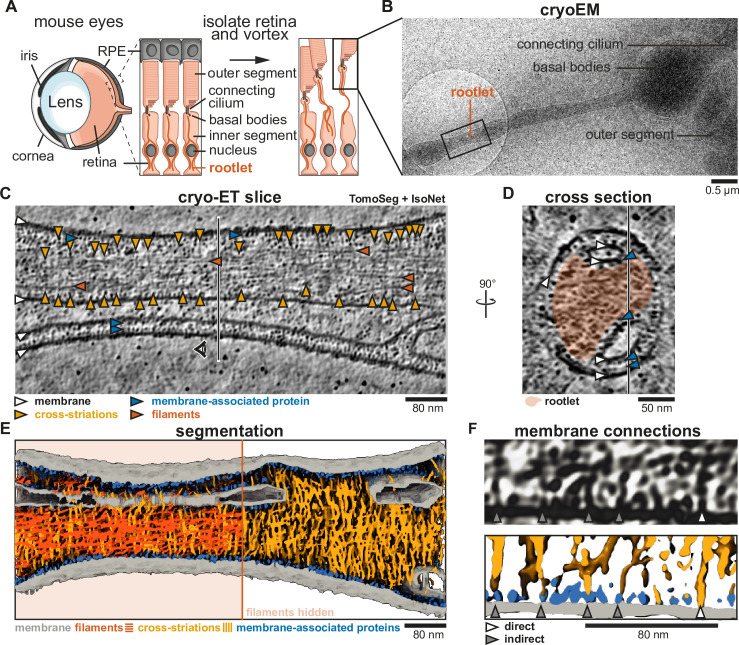
Figure 1. Cross-striations protrude from rootlets and connect to intracellular membranes.
(A) Schematic of photoreceptor cell isolation from mouse eyes. Insets show the interface between photoreceptor cells and retinal pigment epithelium (RPE). (B) Low-magnification cryo-electron tomograph (cryo-EM) of the isolated sample. The black square depicts the location of acquisition of panel C. (C) Slice through a denoised and isotropically reconstructed cryo-electron tomogram. The vertical line indicates the position of the cross-section in panel D. (D) Cross-section of panel C, with the position of panel C indicated by a vertical line. The rootlet is highlighted in orange. (E) Tomogram segmentation using Eman2 TomoSeg (Chen et al., 2017) with filaments displayed in orange on the left half and hidden on the right. (F) Example of a tomogram slice with membrane connections, and their corresponding segmentation, showing direct membrane connections and connections via membrane-associated proteins with gray and white arrows, respectively.


