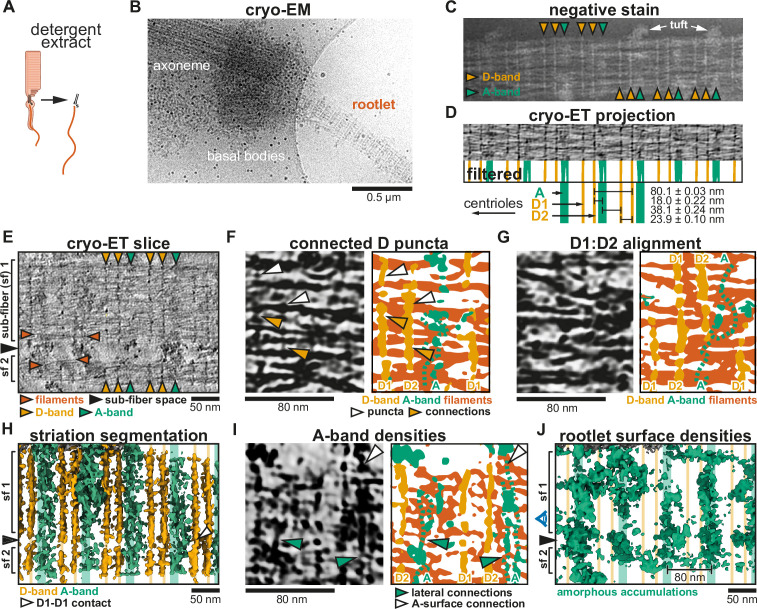
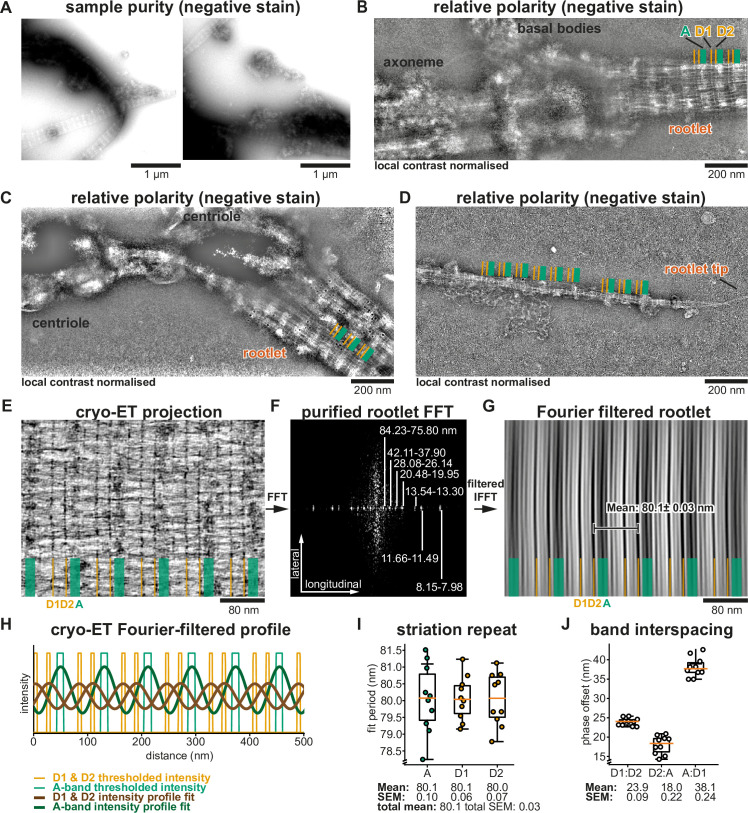
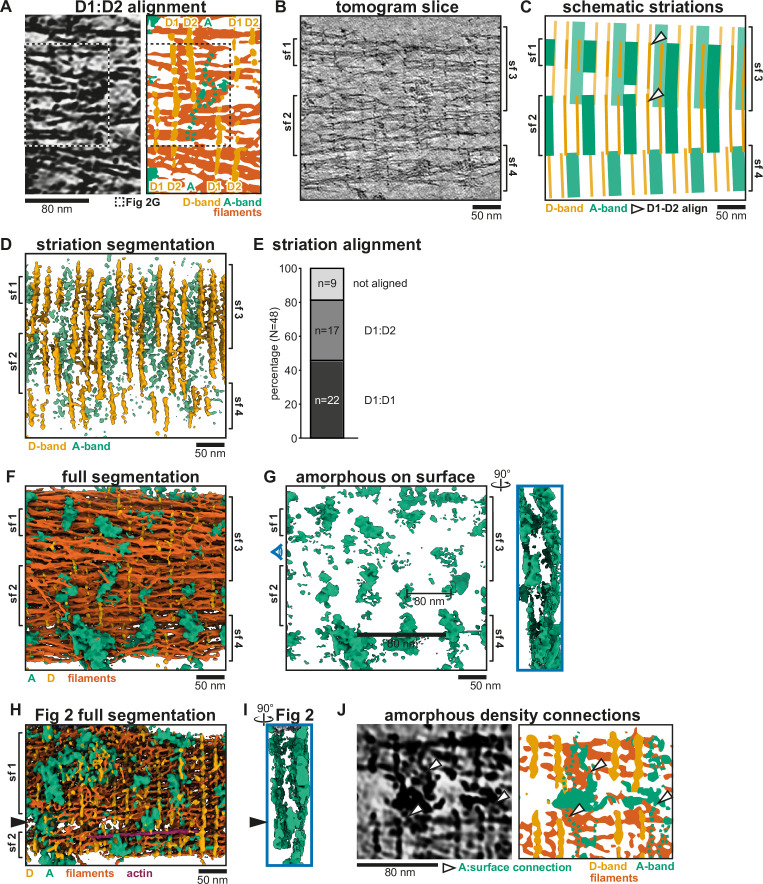
Figure 2. Cryo-electron tomography (cryo-ET) analysis of rootlet striations.
(A) Schematic depiction of rootlet purification by membrane removal and gradient centrifugation (not shown). (B) Low-magnification cryoEM micrograph of a purified rootlet and associated ciliary cytoskeleton. (C) Negative stain EM of a purified rootlet, highlighting features visible on the rootlet surface. (D) CryoET projection image of a purified rootlet. The Fourier-filtered and thresholded striations are colored according to their appearance: D-bands in yellow and A-bands in green. Mean values of their spacing and the location of the centriole are indicated below, based on Figure 2—figure supplement 1H–J. (E) Central slice in a denoised and isotropically reconstructed electron tomogram showing two rootlet sub-fibers. (F) Example of fine features of D-bands in a cryo-ET slice and its segmentation (G) Example where D1 aligns with D2 of a neighboring sub-fiber. Larger view in Figure 2—figure supplement 1A. (H) Segmentation of the striations in the tomogram from panel D. D1–D1 contact of two sub-fibers is indicated by a white arrow. (I) Segmentation that shows amorphous features occur as two bands and connect to the rootlet surface densities. (J) Segmentation of amorphous material on the rootlet surface. The side view is shown in Figure 2—figure supplement 2H (H, J) The position of the A- and D-bands is shown by lines in the background. (E, H, J) Black arrows indicate the space between sub-fibers. (F, G, I) Fainter features not picked up by the automated segmentation were drawn with dotted lines.


