. 2024 Dec 6;12:RP91642. doi: 10.7554/eLife.91642

Figure 3. Rootlet filaments are highly flexible and occur as coiled-coil dimers.

(A) Semi-automated segmentation of a rootlet tomogram. The inset shows a 265-nm long model of stitched rootletin AlphaFold predictions. Filaments that show splaying and merging were manually highlighted in pink. (B, C) Tomogram slices and their corresponding segmentations. (B) Example of thick filaments splaying into thin filaments, each indicated by arrowheads as in the legend of panel C. (C) Example of filament melting pointed out by red arrowheads. (D) Schematic of the location along the rootlet where particles were extracted. (E) The initial average after alignment of 180,252 particles with a wide spherical alignment mask. (F) The initial average of particles aligned with a narrower cylindrical mask. (G) A class average of 34,490 particles, aligned and classified with a narrow mask. The PDB structure (PDB: 2TMA) of two lamin tetramers is shown in red and fitted in the class average.

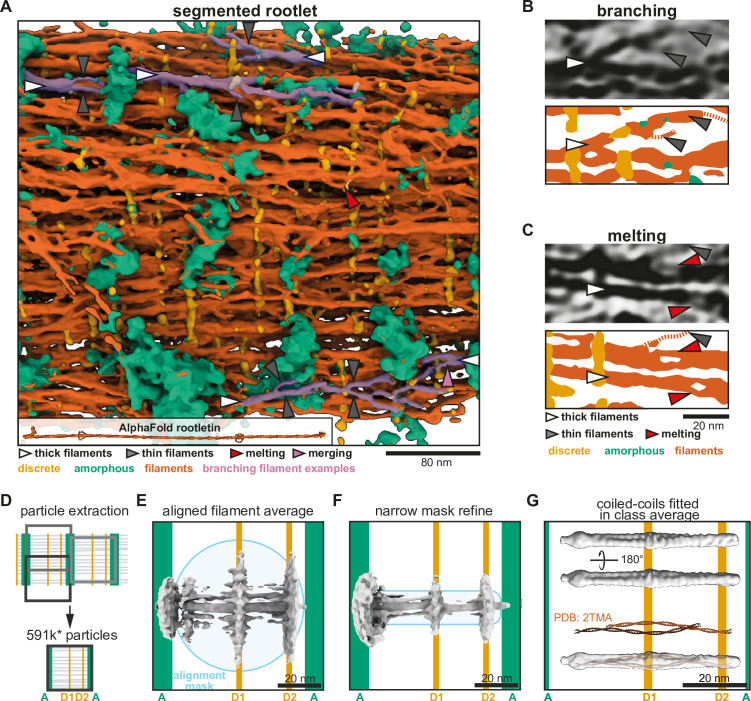
Figure 3.

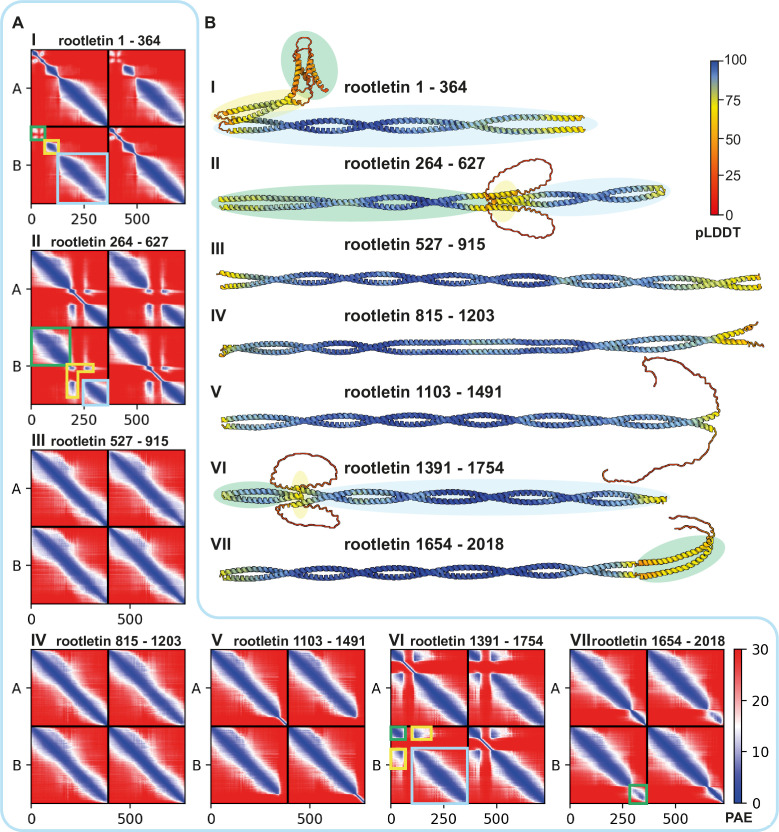
Figure 3—figure supplement 1. AlphaFold predictions of rootletin dimeric fragments.

Figure 3—figure supplement 1.

(A) Predicted Aligned Error (PAE) plots of AlphaFold predictions with identical fragments chains A and B. (A, I) The green square highlights AA 1–60 with low dimerization confidence. Yellow indicates a confident coiled coil for regions 65–175. Blue highlights the rest of the predicted fragment as a coiled coil. (A, II) Green consists of a predicted coiled coil (264–549), PAE scores in yellow show confidence in a short four helix coiled coil between residues 444–469 and 517–541 of both chains. Blue shows the rest of the fragment as a predicted two helix coiled coil. (A, VI) Green shows the initial predicted coiled coil. Yellow highlights the interactions that are predicted as a four-helix bundle between two chains of the coiled coils in green and blue (1438–1445, 1504–1510). (A, VII) green highlights the alpha helices at the C-terminus of rootletin that are predicted to interact (1932–1998). (B) AlphaFold predictions colored according to their pLDDT (predicted Local Distance Difference Test) value. Chain highlights are colored to correspond approximately to the boxes on the PAE plots.
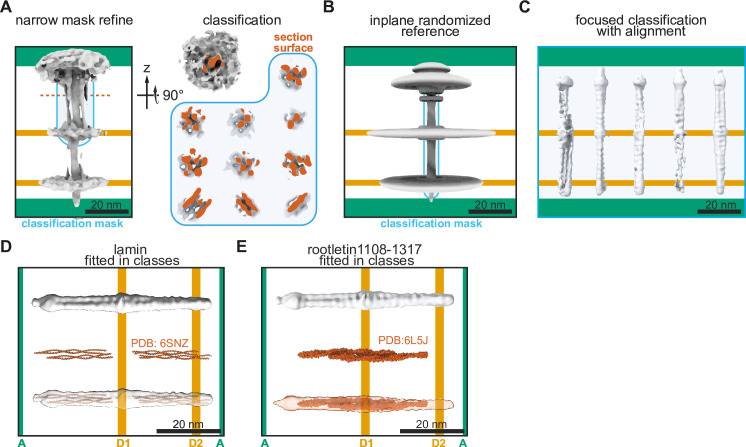
Figure 3—figure supplement 2. Subtomogram averaging and classification of rootlet filaments.

Figure 3—figure supplement 2.

(A) Initial refined average and a top view of a section through its filaments. Class averages of filaments within the blue classification mask are shown in the blue box. The surfaces of a cross-section through the filament classes are shown in orange. The particle distribution is provided in Supplementary file 1a. (B) Average of inplane/rotationally randomized particles originating from the alignments of A. (C) Class averages of a classification with alignment of particles from A. Their particle distribution is shown in Supplementary file 1b. (D, E) Crystal structures of lamin tetramers (Lilina et al., 2020) and rootletin 1108–1317 tetramer (Ko et al., 2020) fitted in the density of class 5 from panel C.