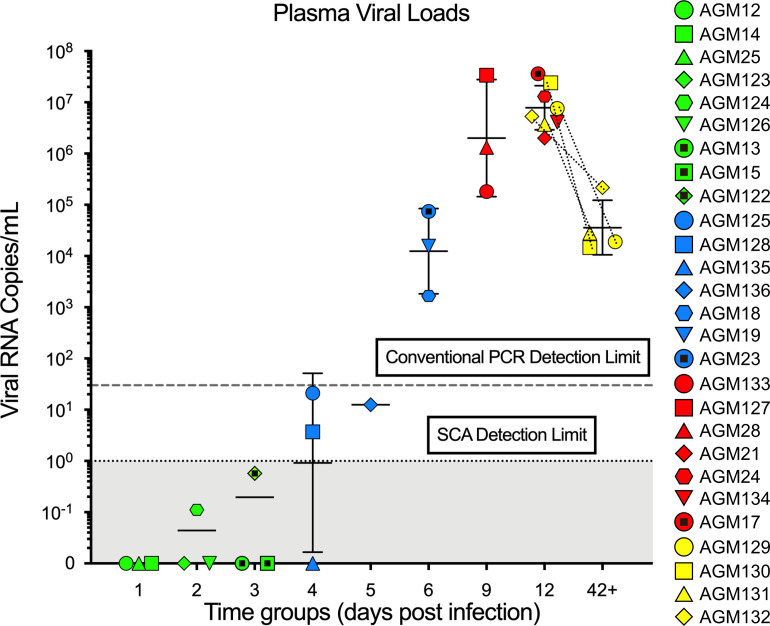
Figure 1. Plasma VLs in African green monkeys (AGMs) intrarectally (IR) infected with SIVsab.
The plasma VLs are shown as log10 values. Each AGM that became infected after inoculation (n = 27) is represented by symbol with a unique color and shape combination as shown on the right. Blood samples from the chronically infected AGMs (yellow) were sampled both at peak infection and during early chronic infection, as indicated by the appearance of the symbols for those AGMs twice and the dotted lines connecting the same animal. Limits of detection for conventional and single-copy assays are shown by dotted horizontal lines, with the area below the SCA limit shaded in gray. The colors represent the different stages of infection, as defined by viral replication status: pre–ramp-up (green), ramp-up (blue), peak (red), and set point (yellow). The bars represent the geometric mean and SD of each group. AGMs that were negative for viremia are plotted directly on the x axis.

