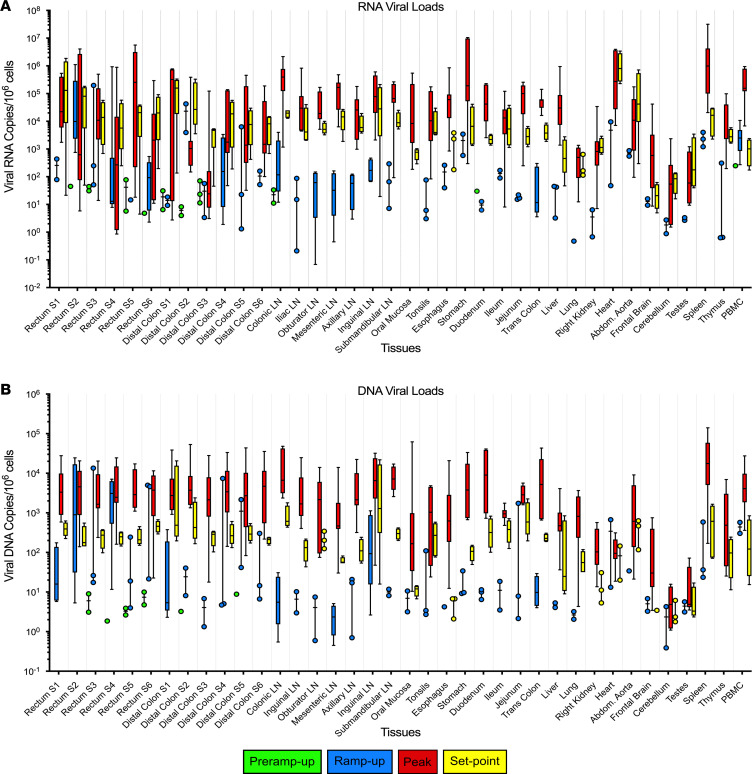
Figure 3. Total viral RNA and DNA in tissues of SIVsab-infected African green monkeys (AGMs).
(A and B) The total viral RNA (A) and DNA (B) from each of the 38 tissues collected from the infected AGMs tested (n = 27) are shown, with dotted lines delineating each individual tissue. Viral loads are shown on a logarithmic scale and represent the total number of SIV genome copies per 1 × 10⁶ cells. The names of the tissues are listed below the x axis. The data are shown as box-and-whisker plots displaying the median, 1st and 3rd quartiles, and the minimum/maximum outliers. The colors represent the different stages of infection as defined by viral replication status: pre–ramp-up (green), ramp-up (blue), peak (red), and set point (yellow). For the rectum and distal colon, S1-S6 indicates from which strip of tissue the section was taken.

