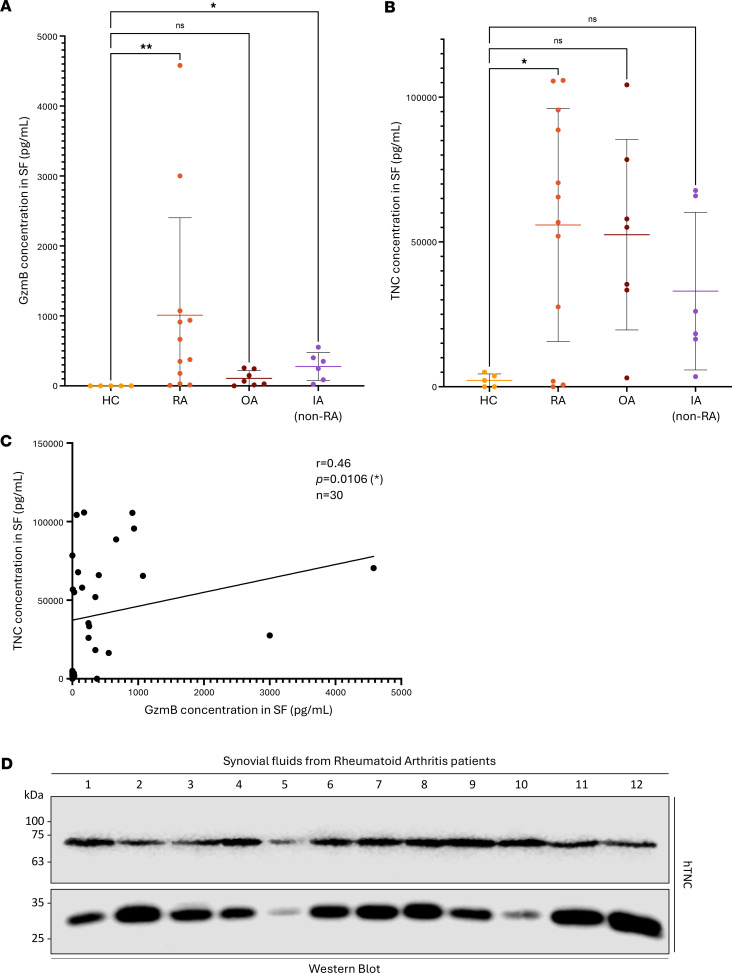
Figure 5. TNC fragments detected in patients with RA align with in silico prediction and in vitro digestion by GzmB.
GzmB (A) and TNC (B) quantification in healthy controls (HC, n = 5), rheumatoid arthritis (RA, n = 12), osteoarthritis (OA, n = 7), and inflammatory arthritis (IA, n = 6) patient SF represented as means ± SD. Statistical analyses were performed using nonparametric ANOVA (Kruskal-Wallis rank-sum test) followed by Dunn’s multiple comparisons test with Bonferroni’s P value adjustment. (C) Correlation (Spearman rank-order) between TNC and GzmB levels in HC, RA, OA, and IA patients’ SF (n = 30). (D) Western blot analysis demonstrating the presence of 2 TNC fragments (70 kDa and 30 kDa) in the SF of 12 patients with RA. *=P < 0.05, **=P < 0.01.

