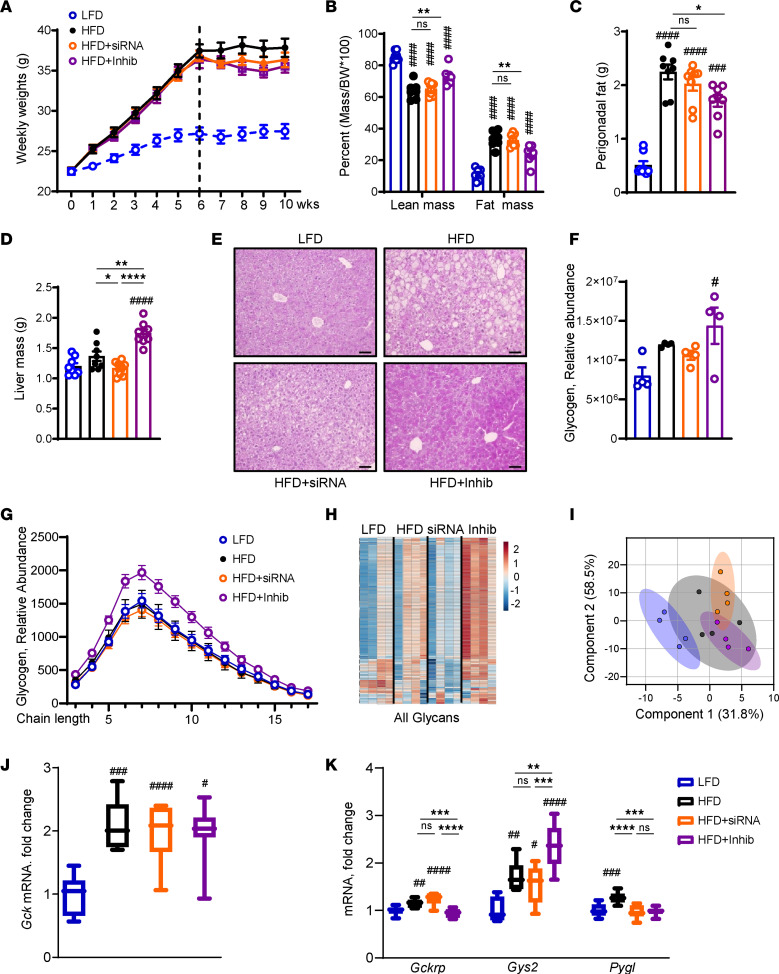
Figure 1. Inhibition of KHK activity, but not its KD, leads to hepatic glycogen accumulation.
(A) Weight gain of mice on low-fat diet (LFD), high-fat diet (HFD), HFD treated with siRNA, and HFD treated with inhibitor for the last 4 weeks of this 10-week experiment. (B) Lean mass and fat mass normalized by body weight as assessed by EchoMRI. Perigonadal adipose tissue (C) and liver (D) weights at the time of sacrifice. n = 7–8 mice per group. (E) Representative periodic acid–Schiff (PAS) stained images of liver histology. Bar = 50 μm. (F) Mass spectrometry (MS) analysis for glycogen in the liver. (G) Glycogen chain length as determined by MS. (H) Heatmap of all glycans and (I) principal component analysis of all glycans in LFD, HFD, HFD + siRNA, and HFD + Inhib groups. n = 4 mice per group. mRNA expression of Gck (J) and the genes involved in (K) glycogen synthesis and degradation. n = 6 mice per group. Statistical analysis was performed using 1-way ANOVA compared with LFD group (#P < 0.05; ##P < 0.01; ###P < 0.001; ####P < 0.0001) with post hoc 2-tailed t tests between the individual groups (*P < 0.05; **P < 0.01; ***P < 0.001; ****P < 0.0001).

