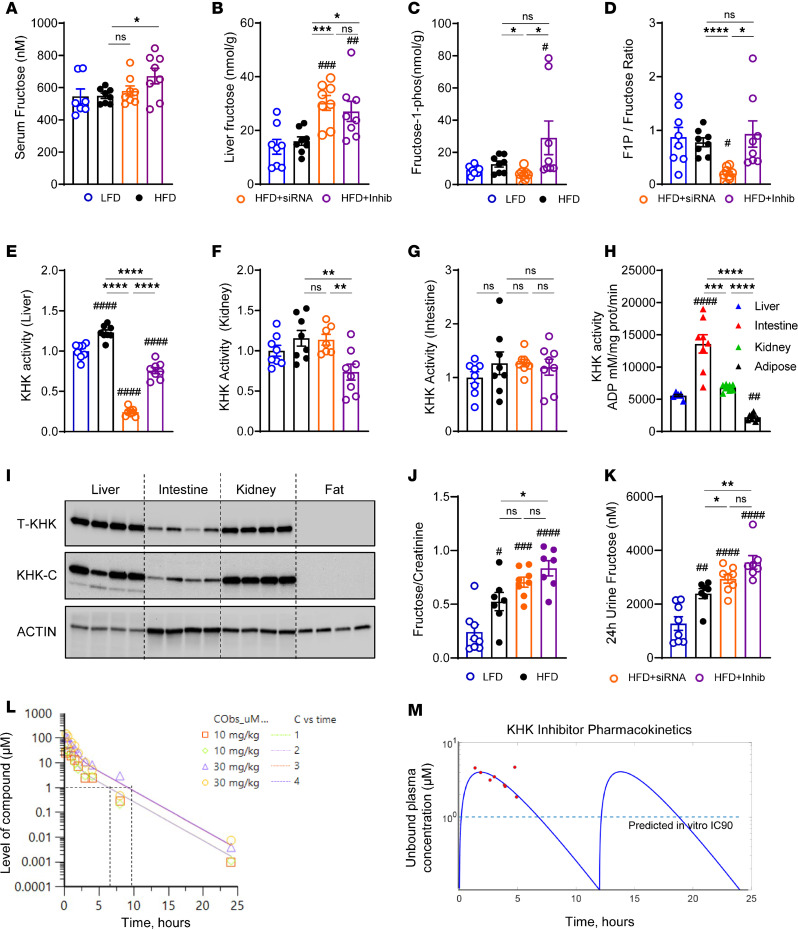
Figure 2. Small molecule inhibitor decreases KHK enzymatic activity in liver and kidney but not in intestine.
(A) Serum fructose level from the mice at sacrifice. The levels of (B) fructose (C) and fructose 1-phosphate (F1P) and the ratio of (D) F1P/fructose in the liver. n = 7–8 mice per group. Quantification of KHK activity in (E) liver, (F) kidney, and (G) intestine. (H) Absolute KHK activity in liver, intestine, kidney, and perigonadal adipose tissue. (I) Western blot of total KHK and KHK-C in liver, intestine, kidney, and perigonadal adipose tissue. n = 4 mice per group. Actin was used as a loading control. (J) Urinary fructose level corrected by urine creatinine and (K) fructose excretion in urine over 24 hours. (L) In vivo monitoring of the inhibitor concentration over 24 hours following single gavage with 10 mg/kg or 30 mg/mL of the inhibitor. n = 2 mice per group. (M) Unbound plasma concentration of the inhibitor (red dots) quantified by MS in LFD-fed mice, 2–5 hours after last dose of the inhibitor. Pharmacokinetic model fitting (blue line) based on inhibitor concentration (red dots). Dashed line represents target concentration. Statistical analysis was performed using 1-way ANOVA compared with the LFD group (#P < 0.05; ##P < 0.01; ###P < 0.001; ####P < 0.0001) with post hoc 2-tailed t tests between the individual groups (*P < 0.05; **P < 0.01; ***P < 0.001; ****P < 0.0001).

