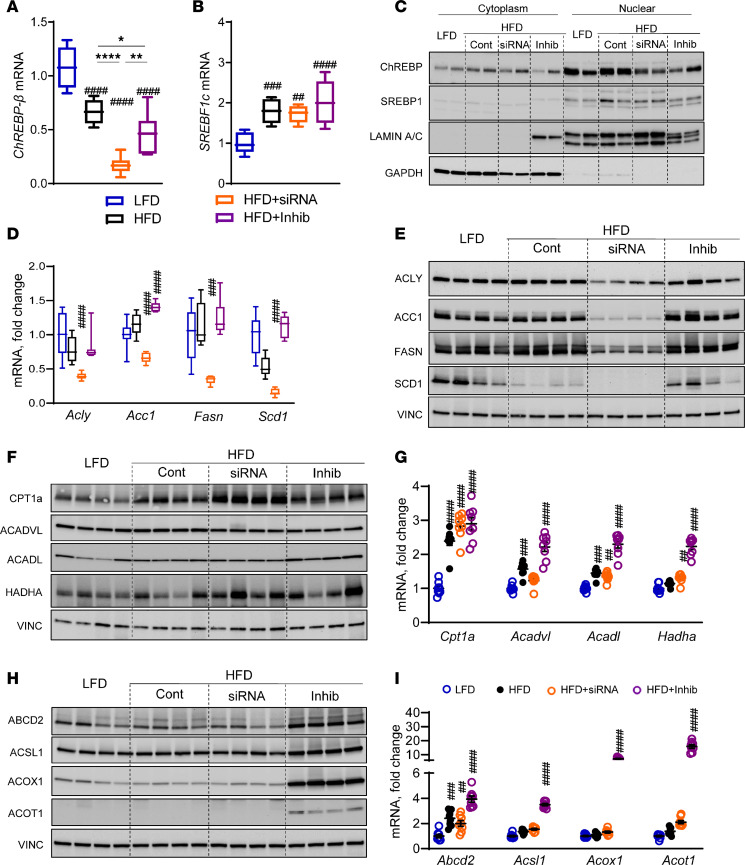
Figure 6. KHK KD lowers the DNL, while the inhibitor increases the FAO pathway.
(A) ChREBP-β (MLXIPL-β) and (B) SREBF1c mRNA expression in the livers of our experimental mice. Box plots show the interquartile range, median (line), and minimum and maximum (whiskers). (C) Western blot showing nuclear translocation of ChREBP and SREBP1 proteins in the liver. (D) mRNA and (E) Western blot quantification of proteins involved in DNL. (F) Protein and (G) mRNA expression of genes regulating mitochondrial FAO. (H) Protein and (I) mRNA expression of genes regulating peroxisomal FAO. n = 7–8 mice per group for mRNA expression and n = 4 mice per group for protein quantification. Statistical analysis was performed using 1-way ANOVA compared with the LFD group (##P < 0.01; ###P < 0.001; ####P < 0.0001) with post hoc 2-tailed t tests between the individual groups (*P < 0.05; **P < 0.01; ****P < 0.0001).

