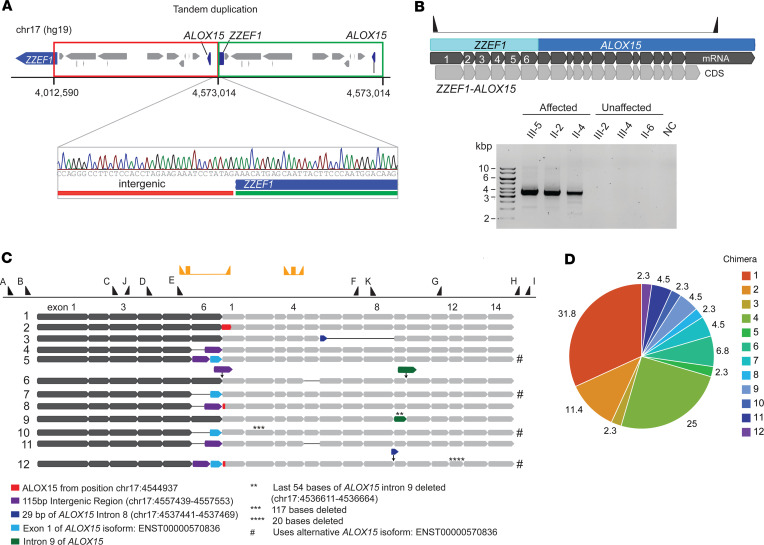
Figure 3. Molecular determination of the fusion gene and chimeric transcripts.
(A) Schematic of the genic region of chr 17 and sequence view of the junction of the tandem duplication. (B) Schematic of the fusion gene and the transcript (top panel) and segregation of the chimeric transcript using gel electrophoresis (bottom panel). Only affected individuals show bands of matching size to the predicted model for the Chimera 1 transcript. NC, negative control. (C) Schematic representation of the 12 chimeric transcript isoforms captured by cloning and Sanger sequencing. The dark gray thick arrow bars represent the ZZEF1 transcript, while the light gray thick arrow bars represent the ALOX15 transcript. The numbers on exons correspond to the exon number from NM_001140.3 (ALOX15), ENST00000570836.1 (alternative ALOX15 isoform), and NM_015113.3 (ZZEF1) transcripts. Hashtag (#) symbols are used to indicate chimeric transcripts of ALOX15 ENST00000570836.1 isoform. Thick arrow bars in assorted colors represent sections of the transcript different from the Chimera 1 transcript as defined by the legend below the image. Black thin lines between arrow bars represent exon skipping. Thin arrows pointing down represent insertions. Black triangles along the top represent primer positions along the fusion gene used in Sanger sequencing (A=pJET forward primers B=p5516, C=p5670, D=p5581, E=p5518, F=p5582, G=p5673, H=p5578, I=pJET reverse, J=p5772, and K=p5773; Supplemental Table 5). The yellow triangles and rectangles represent chimera and ALOX15 primers and probe for digital PCR. (D) Relative frequency of each chimeric transcript found by cloning. A total of 44 CFU were sequenced. Chimera 1 (31.8%) and 4 (25%) are most abundant.

