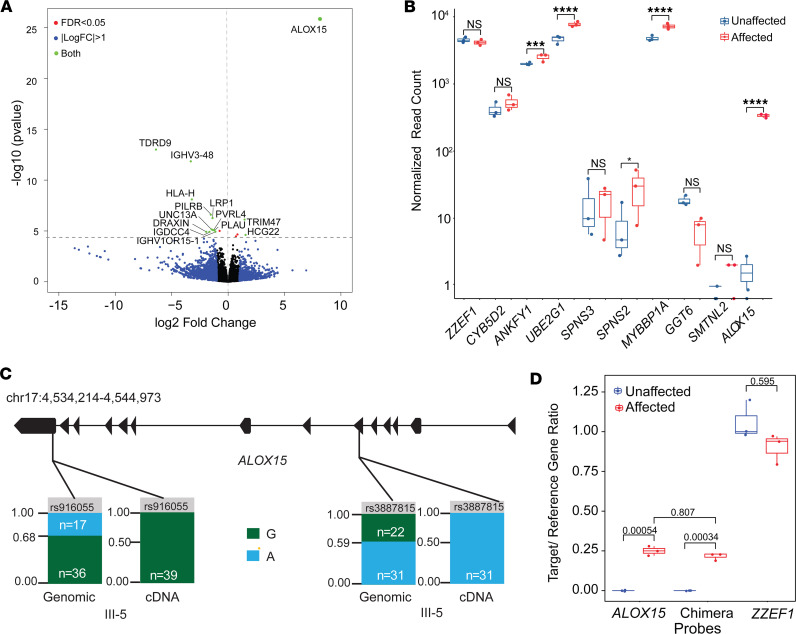
Figure 4. RNA DGE analysis.
(A) Volcano plot showing differentially expressed genes (DEGs) in affected (n = 3) and unaffected LCLs (n = 3). The x and y axes indicate the log2fold-change of genes and corrected Benjamini-Hochberg P value, respectively. Genes above the horizontal blue line are differentially expressed with a P < 0.05. Blue dots represent genes with a log2fold-change > 1, the red dots indicate DEGs with a P < 0.05, and the green dots are genes that have both a significant P value and fold-change. Black dots neither have a significant P value nor have a significant fold-change. Genes to the left of the vertical line are underexpressed, while genes to the right are overexpressed, in affected compared with controls. ALOX15 is highly upregulated in patients. (B) Box plot graph comparing the expression of genes within the chr 17 duplication between the 3 unaffected and 3 affected family members. ALOX15 had the greatest difference in gene expression (**** = P ≤ 0.0001, *** = P ≤ 0.001, * = P ≤ 0.05) (unpaired, 2-sample t test). Box plots show the interquartile range, median (line), and minimum and maximum (whiskers). (C) ALOX15 allele count comparison in genomic data versus RNA-Seq data in the proband. Bar charts display the allele read count of the G allele (green) and the A allele (blue) at each position. Both single nucleotide polymorphisms showed preferential expression for an allele at the RNA level. (D) Comparison of the expression levels of 3 transcripts (Chimera, ALOX15, and ZZEF1), between affected (n = 3) and unaffected family members (n = 3), using droplet digital PCR. The y axis shows the normalized target gene expression. Only the affected express the chimeric transcript and ALOX15. For ZZEF1, the expression levels between the 2 groups are similar (2-sample t test, Bonferroni-adjusted P values indicated on the graph).

