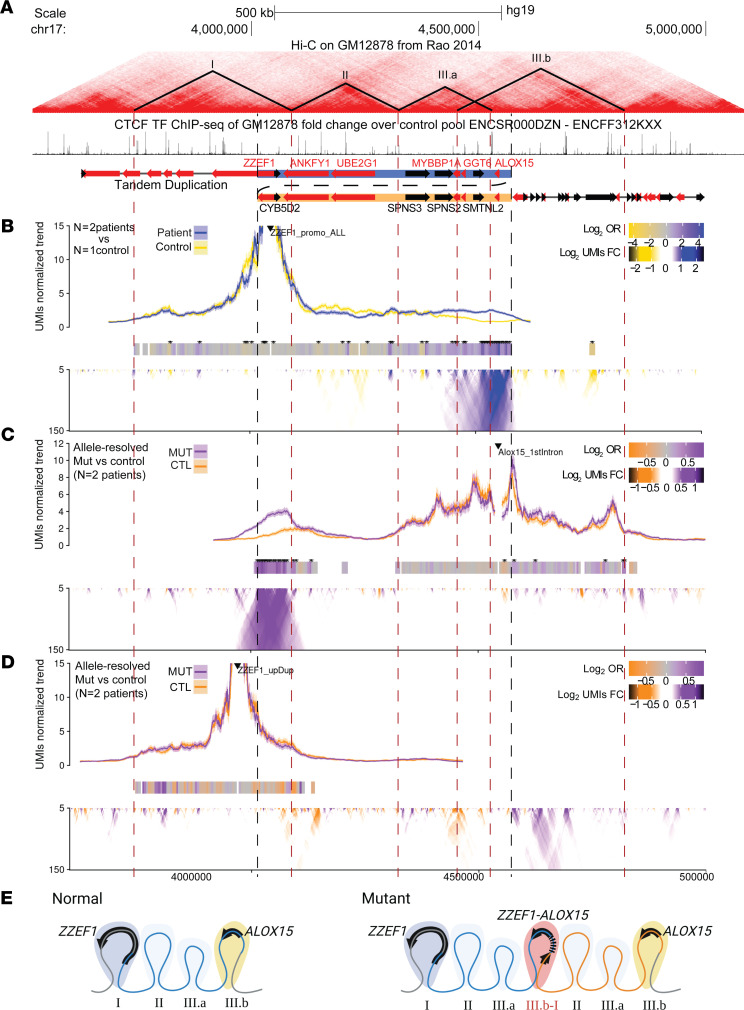
Figure 8. TAD architecture due to the tandem duplication.
(A) Genome topology around the tandem duplication showing Hi-C contacts, putative TAD boundaries, CTCF binding sites, and genes (32). Black and red arrows denote forward and reverse strand, respectively. Dashed red lines denote TAD boundaries; dashed black lines denote the tandem duplication boundaries. (B–D) Chromatin contacts were assessed using UMI-4C. Black triangle marks position of baits. Trend lines show the normalized contact frequency. Domainograms show the differential contact frequencies. Bar heatmap with * (adjusted P < 0.001) shows regions that are significantly different in contact frequency. Comparisons were made between either the WT and tandem duplicated (Dup) allele in patient samples or between control (n = 1) and patient (n = 2) samples. (B) ZZEF1 promoter: non-allele-specific bait upstream of the ZZEF1 promoter shows patient-specific contacts with ALOX15. (C) ALOX15 1st Intron: allele-specific bait within the first intron of ALOX15 shows contacts with ZZEF1 only on the Dup allele. (D) ZZEF1 Dup: allele-specific bait within ZZEF1 gene body outside of the duplication shows no change in contacts between Dup and WT allele. (E) Schematic depicting the “neo-TAD” formed at the duplication junction.

