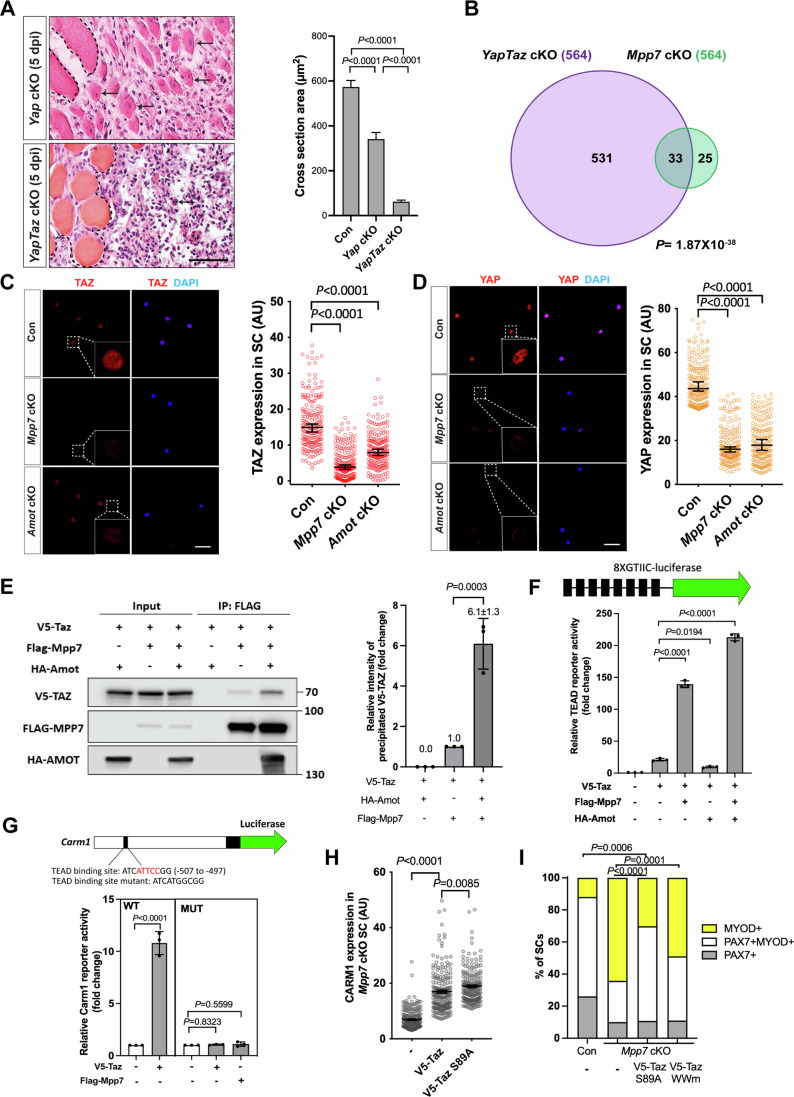
Figure 4. Mpp7/Amot regulatory network intersects with that of Yap/Taz.
(A) H&E histology of Yap cKO and YapTaz cKO muscles at 5 dpi (Con (Pax7CreERT2/+) histology not included); quantifications of regenerated myofiber cross-sectional area to the right. (B) Venn diagram shows overlapping DEGs between the YapTaz cKO and the Mpp7 cKO. (C, D) IF images of TAZ (C) and YAP (D) in FACS-isolated and cultured Con (Pax7CreERT2/+), Mpp7 cKO, and Amot cKO MuSCs at 48 h; relative fluorescent signals (in AU) to the right. (E) Co-IP of V5-TAZ and HA-AMOT by FLAG-MPP7 expressed in 293 T cells; tagged epitopes used for IP and Western blotting are indicated; (−), empty expression construct. Quantification of relative levels of co-IPed V5-TAZ is to the right. (F) Relative TEAD-reporter (8XGTIIC-luciferase, depicted at top) activities when co-transfected with V5-Taz, Flag-Mpp7, and/or Ha-Amot constructs in 293T cells; (−), empty expression construct. (G) Relative activities of WT and TEAD-binding site mutated (MUT) Carm1-reporters co-transfected with V5-Taz or Flag-Mpp7 constructs; (−), empty expression construct. (H) Relative IF signals (AU) of CARM1 in Mpp7 cKO MuSCs transfected with empty vector (−), V5-Taz WT and V5-Taz S89A constructs (all with IRES-mGFP) (I) Relative cell fate fractions among Con (Pax7CreERT2/+), Mpp7 cKO, and Mpp7 cKO MuSCs transfected with V5-Taz S89A and V5-Taz WWm construct in single myofiber culture; Con (−) and Mpp7 cKO (−) from Fig. 2C; keys at the top. Data information: Scale bar = 50 µm in (A) and 25 µm in (C, D). (A) N = 5 mice in each group; (C, D, H) 200 cells from 2 to 3 mice in each group; (E–G) n = 3 biological experiments; (I) ≥ 150 cells in each group. Bars represent medians ± 95% CI (C, D, H) or means ± SD (A, E, F, G). Hypergeometric test was used in (B), one-way ANOVA with Tukey’s post hoc test performed in (A, E, F, G), Kruskal–Wallis test followed by Dunn’s multiple comparisons test in (C, D, H), and Chi-square test used in (I). Source data are available online for this figure.

