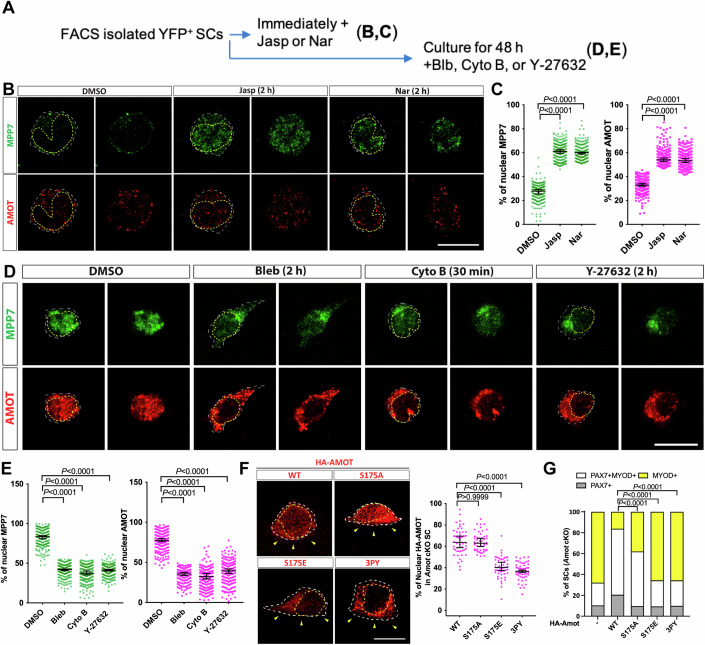
Figure 6. F-actin states impact on AMOT localization and function through TAZ/YAP.
(A) Experimental flowchart to investigate the impact of F-actin on the localization of MPP7 and AMOT in FACS-isolated MuSCs. (B) Representative IF images of MPP7 and AMOT of freshly isolated MuSCs treated with DMSO (control), 100 nM Jasplankinolide (Jasp), or 100 nM Narciclasine (Nar) for 2 h. (C) Percentages of MPP7 or AMOT IF signals in the nucleus (versus total signals) in each SC were quantified. (D) Representative IF images of MPP7 and AMOT in MuSCs cultured for 48 h and then treated with DMSO (control), 10 µM Blebbinstatin (Bleb), 10 µM Cytochalasin B (Cyto B), or 10 µM Y-27632 for indicated time prior to assay; (E) quantification same as in (C). (F) Localization of HA-tagged AMOT WT, AMOT S175A (S175A), AMOT S175E (S175E), and AMOT 3PY (3PY) expressed (via transfection) in Amot cKO MuSCs on SM by IF for HA; yellow arrowheads, apical side. Percentages of nuclear signals (of total signal) of each variant were quantified. (F) HA-AMOT variants in (G) were transfected into Amot cKO MuSCs on SM; Amot cKO (-/WT) from Fig. 2I. Cell fates of transfected cells were determined by IF for HA, PAX7 and MYOD and quantified. Data information: Scale bars = 10 µm in (B, D). (C, E) 200 MuSCs in each group; (F) 50 MuSCs in each group; (G) ≥ 145 cells in each group. Bars represent medians ± 95% CI in (C, E, F) and means ± SD in (F). Kruskal–Wallis test followed by Dunn’s multiple comparisons test in (C, E, F) and Chi-square test in (G). Source data are available online for this figure.

