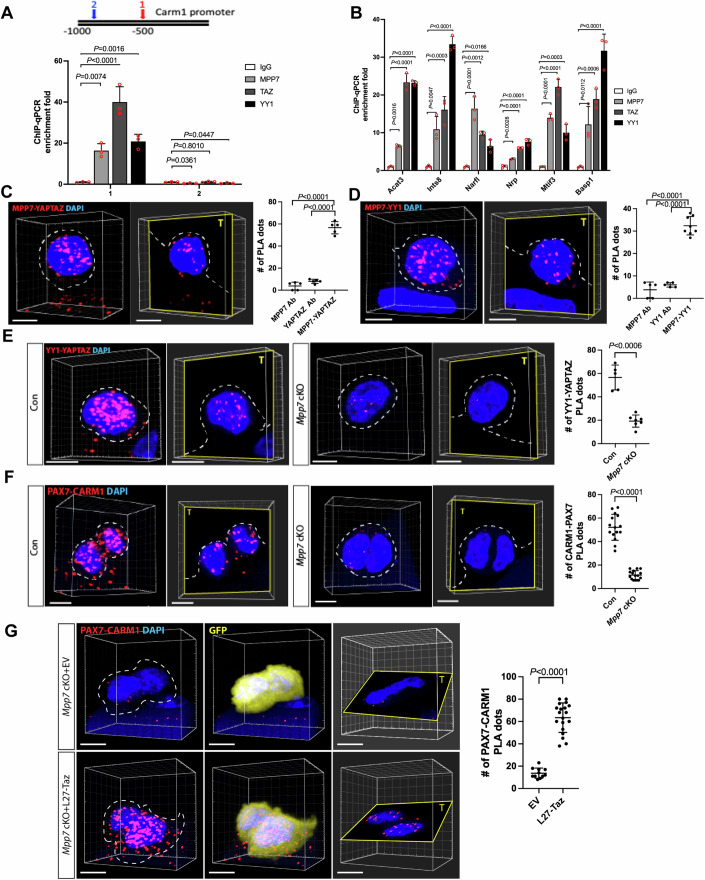
Figure 8. Chromatin binding and protein association support convergence of MPP7, YY1, and TAZ/YAP.
(A) ChIP-qPCR shows MPP7, YY1, and TAZ binding to Carm1 promoter (diagramed a top) at site 1 (red) harboring both TEAD and YY1 binding sites, but not at a distal site 2 (blue) without either binding site; IgG, negative control. Bar graph shows fold-enrichment (by Bio-Rad CFX Maestro); keys to the left. (B) Same as in (A) with 6 more common DEG promoters (x-axis) with YY1 and TEAD binding sites; keys and quantification as in (A). (C) Representative PLA images for MPP7 and YAP/TAZ in 3D reconstruction and single plane, countered stained with DAPI; quantification to the right. (D) Same as in (C) for MPP7 and YY1.(E) Same as in (C) for YY1 and YAP/TAZ in Con (Pax7CreERT2/+) and Mpp7 cKO. (F) Same as in (E) for CARM1-PAX7; (G) Restoring CARM1-PAX7 PLA signal by L27-TAZ but not by empty vector (EV, with IRES-mGFP, same as (−) in previous figures). Each data point in (C–G) represents PLA dots in a cell quantified by 3D imaging. Single Ab controls are shown in Appendix Fig. S8C. Data information: Scale bars = 5 µm (C–G). (A, B) n = 3 biological replicates. (C) 5 MuSCs for each group; (D) 5 MuSCs for MPP7 or YY1 and 8 MuSCs for MPP7-YY1; (E) 5 MuSCs for Con (Pax7CreERT2/+) and 7 MuSCs for Mpp7 cKO; (F) 15 MuSCs for Con and 16 MuSCs for Mpp7 cKO; (G) 11 MuSCs for EV and 19 MuSCs for L27-Taz. Error bars represent means ± SD. One-way ANOVA with Tukey’s post hoc test in (A–D). Student’s t test (two-sided) in (E–G). Source data are available online for this figure.

