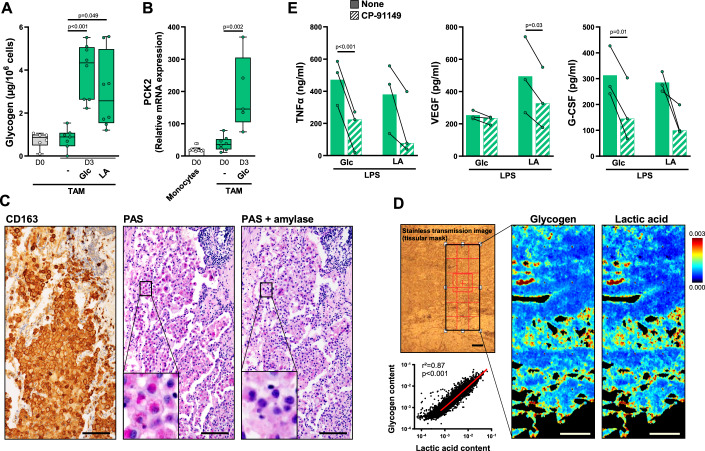
Figure 4. Tumor-associated macrophages store glycogen and are capable of glyconeogenesis.
(A, B) TAM isolated from ovarian cancer ascites were cultured in Glclow Glnlow medium containing GM-CSF and IFNγ supplemented with Glc or lactic acid. Glycogen (A; n = 6–8) and relative mRNA expression of PCK2 (B; n = 5–13) were quantified in freshly purified TAM and after 3 days of culture. The boxplots display a median line, interquartile range (IQR) boxes, min to max whiskers. (C) Immunohistochemical analysis of CD163 expression in lung adenocarcinoma. On the same tissue section, glycogen was detected by PAS staining, after treatment or not with amylase; scale bar, 100 µm. (D) Lactic acid and glycogen quantification by FTIR spectroscopic imaging in lung adenocarcinoma. Left panel: unstained bright field image; right panel, glycogen and lactic acid maps; scale bar, 200 µm; linear correlation between lactic acid and glycogen contents in infiltrating lung adenocarcinoma was calculated (results are representative 1 out of 2 biologically independent experiments). (E) Day 3 TAM were treated or not with CP-91149 for 15 min before a 6 h stimulation with LPS. TNFα, VEGF and G-CSF were quantified by ELISA (n = 3). Values are represented as the mean ± SEM, each dot represents a different donor. Statistical significance was determined by Welch’s ANOVA test followed by Dunnett’s multiple comparison post hoc test (A), or by two-tailed unpaired Welch t test (B) or by paired t test (E). *P < 0.01, **P < 0.005, ***P < 0.001, ****P < 0.0001. Source data are available online for this figure.

