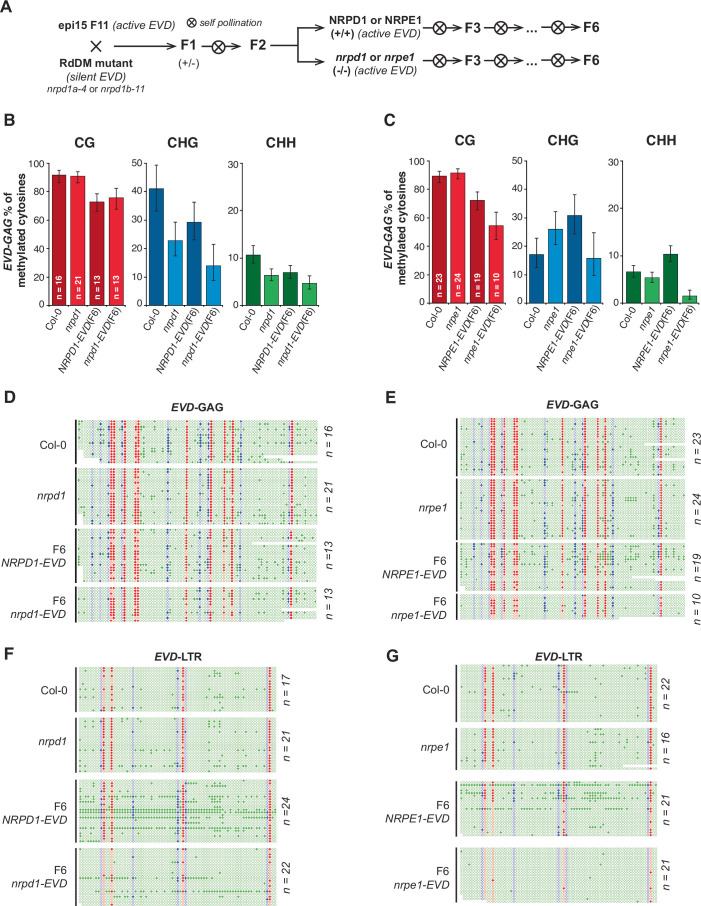
Figure EV4. BS-PCR analysis of EVD-GAG DNA methylation levels in RdDM mutants.
(A) Crossing scheme to generate nrpd1- and nrpe1-EVD lines. F2 plants were genotyped to select homozygous WT and mutant lines for each background and propagated through selfing until the F6 generation. (B, C) % methylated cytosines by bisulfite -PCR DNA methylation analysis at EVD-GAG sequences in the F6 generation of NRPD1-EVD (B) and NRPE1-EVD (C) lines, in both WT (darker shade) and mutant (lighter shade) backgrounds. Col-0, nrpd1 and nrpe1 were used as controls. Error bars represent 95% confidence Wilson score intervals of the % of methylated cytosines (C) in each context (CG, CHG, CHH). (D, E) Dot-plot representation of bisulfite-PCR sequencing data for the F6 generation of NRPD1-EVD (D) and NRPE1-EVD (E) lines, in both WT and mutant backgrounds, at EVD-GAG sequences. Col-0 and nrpd1 or nrpe1 were used as control for the endogenous parental EVD copies. (F, G) Dot-plot representation of bisulfite-PCR sequencing data for the F6 generation of NRPD1-EVD (F) and NRPE1-EVD (G) lines, in both WT and mutant backgrounds, at EVD-LTR sequences. Col-0 and nrpd1 or nrpe1 were used as control for the endogenous parental EVD copies. In all dot-plots, filled circle represent methylated, empty circles unmethylated cytosines in the CG (red), CHG (blue), and CHH (green) context. Source data are available online for this figure.

