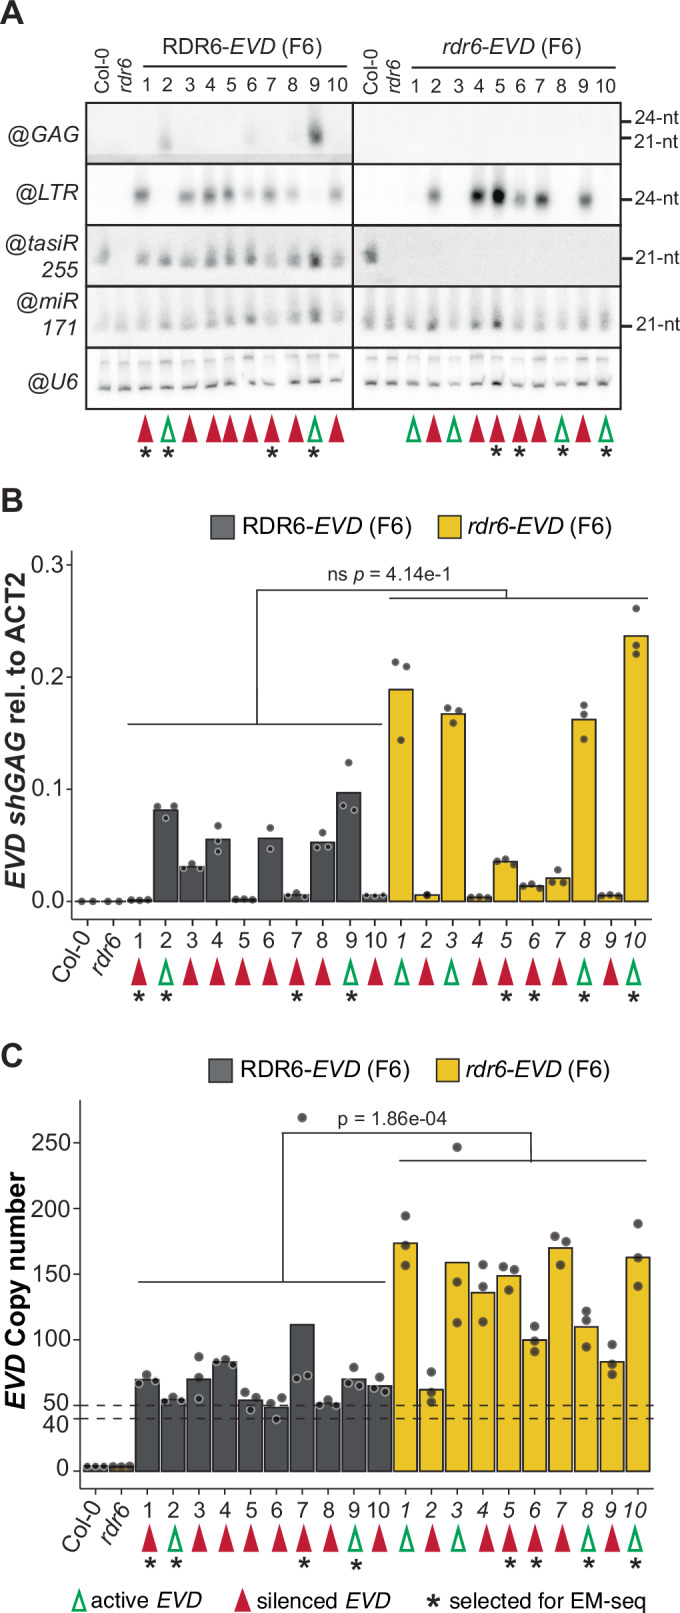
Figure 2. Characterization of EVD silencing status in RDR6- and rdr6-EVD F6 individuals.

(A) RNA blot analysis of EVD siRNAs against GAG and LTR in 10 F6 individual plants of RDR6-EVD and rdr6-EVD lines. tasiR255 probe is used as control for RDR6 mutation, miR171 and snoRNA U6 are shown as loading controls. WT Col-0 and rdr6 with no reactivated EVD are shown as negative control for EVD activity. (B) Analysis of EVD shGAG expression of the same individuals investigated in A by qPCR, normalized to ACT2. (C) EVD copy number analysis by qPCR of the same individuals investigated in (A) and (B), using the EVD-GAG sequence as target. In (B) and (C), qPCR technical replicates for each sample are represented by dots. p-values for two-sided t-test between indicated samples are shown. Differences are considered statistically significant if p < 0.05 (5.00e−2) or non-significant (ns) if p ≥ 0.05. Green and red arrows indicate individuals with active and silenced EVD copies, respectively, selected individuals for subsequent EM-sequencing are indicated by an asterisk in (A–C). Source data are available online for this figure.
