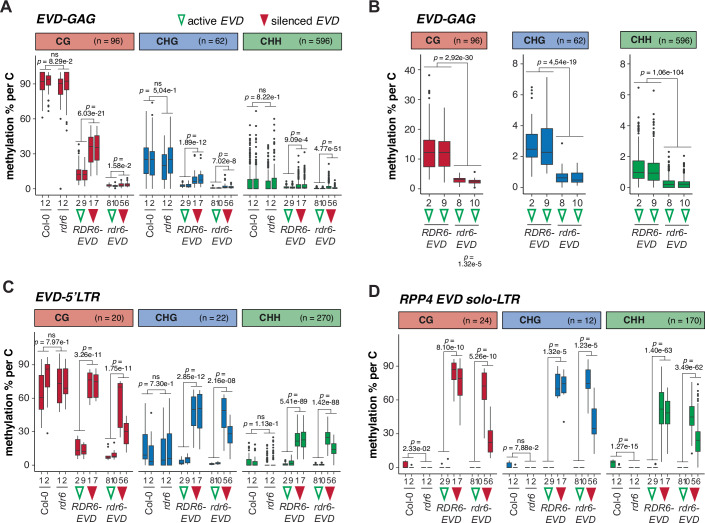
Figure 3. DNA methylation of active and silenced EVD in RDR6- and rdr6-EVD lines.
EM-seq analysis of DNA methylation (as methylation % per cytosine) in CG, CHG, and CHH contexts in WT Col-0, rdr6 and in RDR6- and rdr6-EVD F6 individuals with active and silenced EVD (marked with empty green and filled red arrowheads, respectively, numbers indicate same individuals as in Fig. 2) in: (A) EVD-GAG; (B) EVD-GAG but only in RDR6- and rdr6-EVD F6 individuals with active EVD; (C) EVD-5′LTR; and (D) EVD solo-LTR in RPP4 (AT4G16869) promoter. In all panels, n indicates the number of cytosines analyzed for each context per sample. In all boxplots: median is indicated by a solid bar, the boxes extend from the first to the third quartile and whiskers reach to the furthest values within 1.5 times the interquartile range. Dots indicate outliers, as data points outside of the above range. Wilcoxon rank sum test adjusted p-values between indicated groups of samples are shown. Differences are considered statistically significant if p < 0.05 (5.00e−2) or non-significant (ns) if p ≥ 0.05. Source data are available online for this figure.

