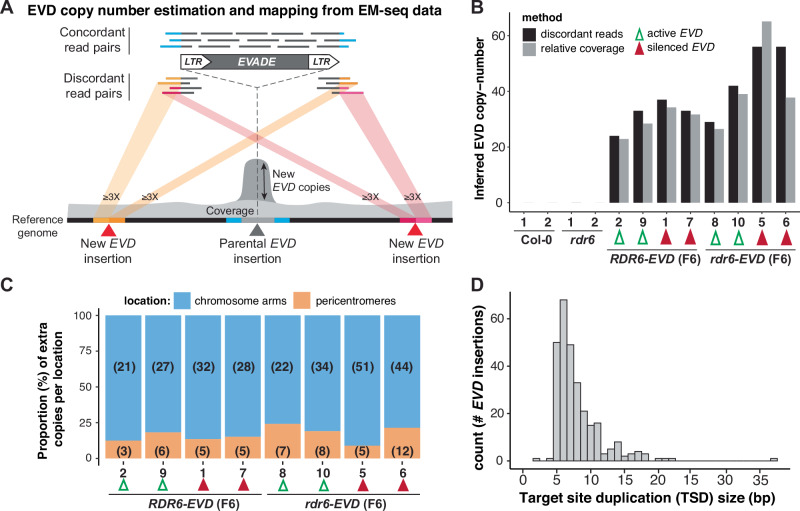
Figure 4. Quantification of new EVD insertions in RDR6- and rdr6-EVD lines from EM-seq data.
(A) Schematic representation of the strategy used to quantify and map new EVD insertions from EM-seq data. EVD copy number was estimated using: (i) the increased EVD coverage of concordant paired read mates in EM-seq data, consequence of EVD transposition or, (ii) mapping new EVD insertions through discordant read pairs mapping to EVD and elsewhere in the genome. New insertions had to be supported by at least three discordant read pairs from each border to be considered. (B) Inferred EVD copy number using either relative coverage or discordant reads in WT Col-0, rdr6 and in RDR6- and rdr6-EVD F6 individuals with active and silenced EVD (marked with empty green and filled red arrowheads, respectively, numbers indicate same individuals as in Figs. 2 and 3). (C) Number and relative proportion (in %) of mapped new EVD insertions in pericentromeric or chromosomic arm locations in each indicated sample. Numbers of new EVD insertions at each location are indicated in brackets. (D) Histogram of the size (in bp) distribution of target site duplications at all new EVD insertions. Source data are available online for this figure.

