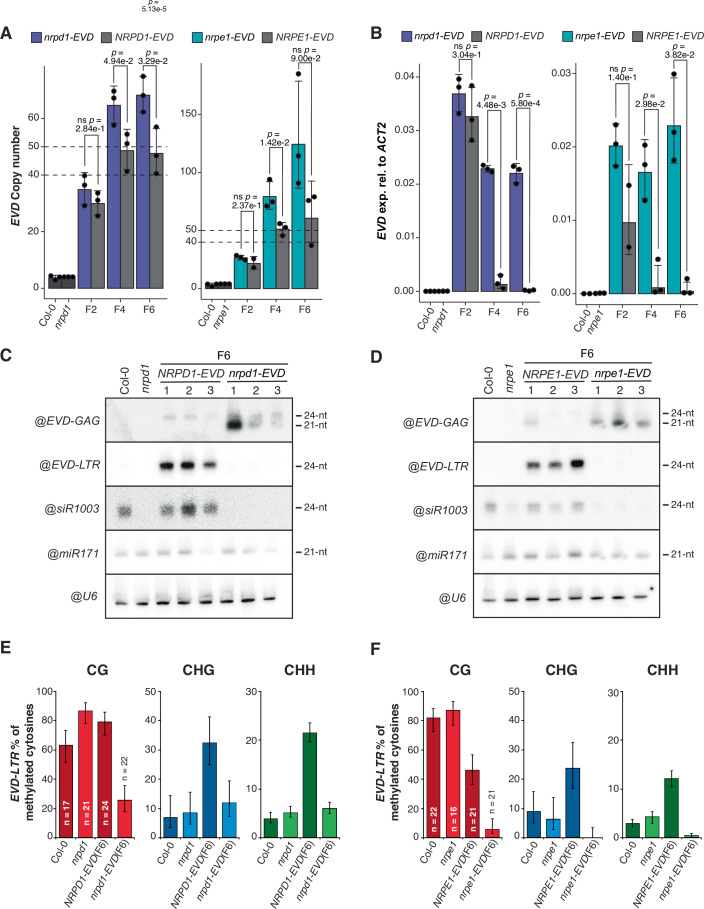
Figure 6. Characterization of EVD proliferation and silencing in RdDM mutants.
(A) EVD copy number analysis by qPCR in NRPD1-EVD and NRPE1-EVD lines, in both WT (gray) and mutant (colored) backgrounds, at generations F2, F4, and F6 derived from three independent F1s (biological replicates), using the EVD-GAG sequence as target. (B) qPCR analysis of shGAG expression normalized to ACT2 in NRPD1-EVD and NRPE1-EVD lines, in both WT (gray) and mutant (colored) backgrounds, at generations F2, F4, and F6 derived from three independent F1s (biological replicates). In (A) and (B), biological replicates (bulks of 8–10 plants each) are individually represented by dots. Error bars show standard error of the mean in (A) and (B). p-values for two-sided t-test between indicated samples are shown. Differences are considered statistically significant if p < 0.05 (5.00e−2) or non-significant (ns) if p ≥ 0.05. (C, D) RNA blot analysis of EVD siRNAs against GAG and LTR in the F6 generation of 3 independent WT and mutant lines of NRPD1-EVD (C) and NRPE1-EVD (D). WT Col-0 and nrpd1 or nrpe1 with no reactivated EVD are shown as negative control for EVD activity. siR1003 probe is used as control for NRPD1 and NRPE1 mutations, miR171 and snoRNA U6 are shown as loading controls. (E, F) % methylated cytosines (C) by bisulfite-PCR DNA methylation analysis at EVD-LTR sequences in the F6 generation of NRPD1-EVD (E) and NRPE1-EVD (F) lines, in both WT (darker shade) and mutant (lighter shade) backgrounds. Col-0, nrp1d and nrpe1 were used as controls. n: number of clones analyzed. Error bars represent 95% confidence Wilson score intervals of the % of methylated cytosines (C) in each context (CG, CHG, CHH). Source data are available online for this figure.

