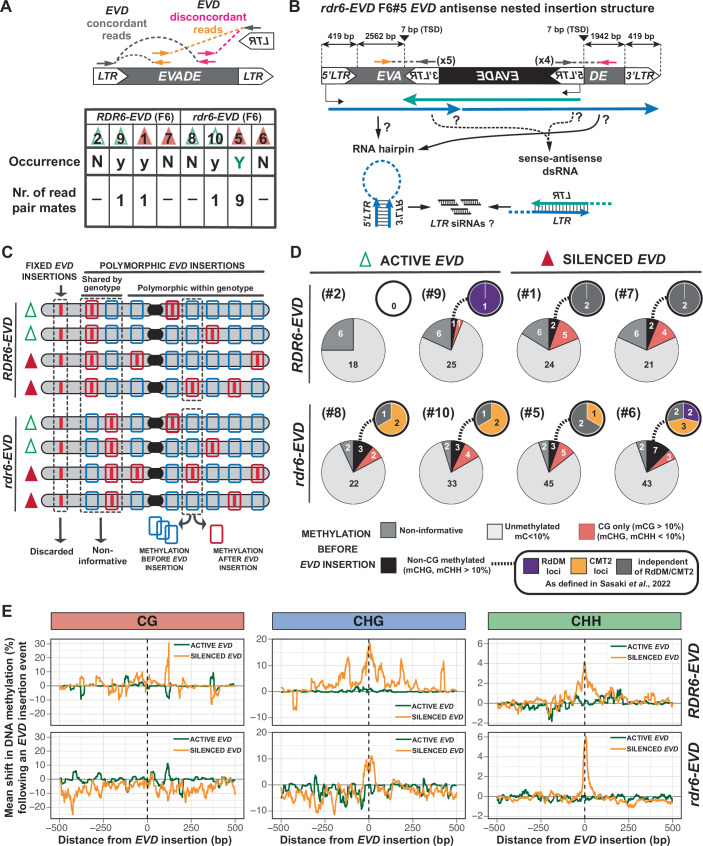
Figure 7. Genetic and epigenetic characterization of EVD insertion sites.
(A) Schematic representation of the strategy used to identify EVD antisense nested insertions within itself from EM-seq discordant paired read mates mapping to EVD-LTR and elsewhere on EVD coding sequence in antisense to the LTR. The table indicates the occurrence and number of read mates found in each sample. Arbitrary threshold of at least two paired read mates by LTR was set to confidentially identify an EVD nested insertion. N: non-occurrence, y: presence of at least one discordant paired read mate, Y: presence of discordant paired read mates and above threshold for confident presence of nested insertion. (B) Scheme of EVD antisense nested insertion structure based on EVD discordant reads in the sample rdr6-EVD F6 #5. Distance between LTRs as well as the length of the target-site duplication (TSD) caused by the insertion are indicated in base-pairs (bp). Colored arrows represent potential EVD transcripts within the locus. Putative sources of small RNAs are depicted below. (C) Schematic representation of methodology used to infer the methylation status of EVD landing sites prior to transposition using the EM-seq data. EVD insertions are represented by red lines. Red boxes indicate regions with new and polymorphic EVD insertions. Blue boxes represent the same region without the EVD insertion. (D) Pie charts of the distribution of insertions within non-methylated, CG-only methylated and non-CG methylated regions within each sample. Inlets represent the classification of non-CG methylated regions into RdDM-, CMT2-dependent or independent of both. Number of insertions in each category is indicated within the chart. (E) Metaplot of the mean shift in DNA methylation following a EVD insertion by genotype and methylation context depending on EVD silencing status. Source data are available online for this figure.

