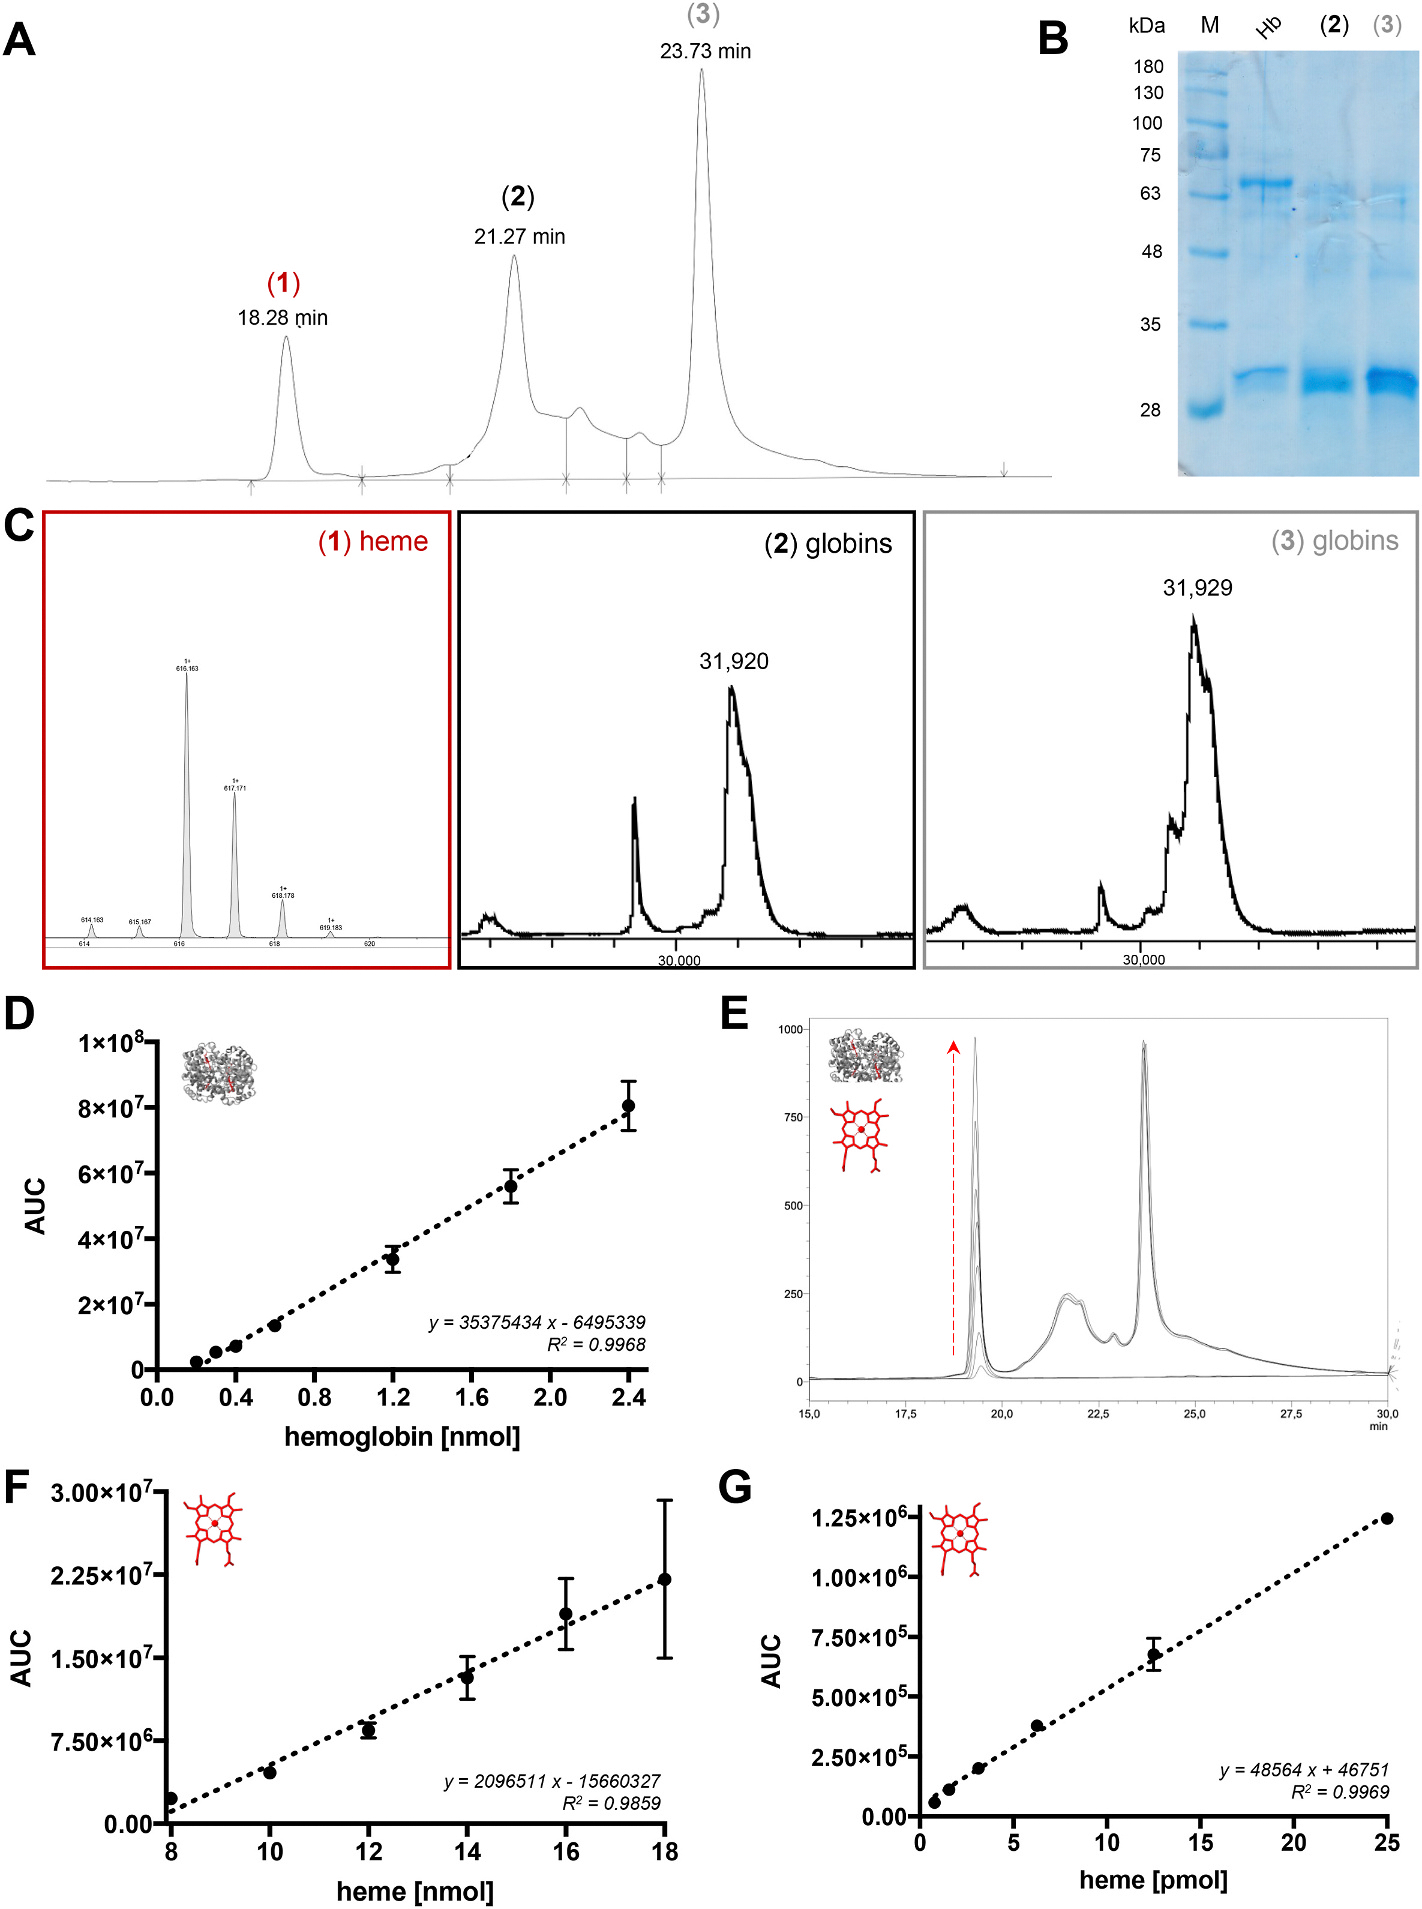
Fig. 3.

HPLC- and ESI-MS-assisted heme and hemoglobin quantification. (A) The HPLC chromatogram of commercially obtained hemoglobin is characterized by three main peaks (1)–(3). The elution time within the applied gradient system of 30–70 % acetonitrile (+0.1 % TFA) in water (+0.1 % TFA) is depicted for each peak. (B) The SDS-PAGE gel of hemoglobin in comparison to peak (2) and (3) from HPLC separation shows that commercial hemoglobin mainly contains the tetrameric (~64 kDa, black box) but also the dimeric (~32 kDa, black arrow) form, whereas the HPLC-separated fractions (2) and (3) predominantly contain the dimeric form of hemoglobin. (C) The MALDI-TOF-MS analysis reveals that heme occurs separately from the globin components of hemoglobin, since only the peak (1) shows an intense heme signal with an m/z of 616.16, while the fractions (2) and (3) contain the protein moieties. Zoom-Ins into the dimeric mass signal are depicted, the complete spectra are found in Supplementary Fig. 6 (D). The calibration curve of hemoglobin for HPLC analysis (y = 35375434 x - 6495339) is valid in the range of 0.2–2.4 pmol hemoglobin at 220 nm using the above-mentioned gradient system and a C4 column. (E) The addition of heme (5–15 μM) to hemoglobin (5 μM) can be observed by the increase of peak (1). However, the differentiation between hemoglobin-derived heme and labile heme is not possible. (F) Under the same conditions, the heme calibration curve (y = 2096511 x - 15660327) is applicable for the range of 8–18 pmol heme. (G) With ESI-MS analysis, heme standard solutions (in 50 % acetonitrile/water) can be quantified in the range of 0.8–25 pmol (y = 48564 x + 46751). Hb, hemoglobin; M, marker.
