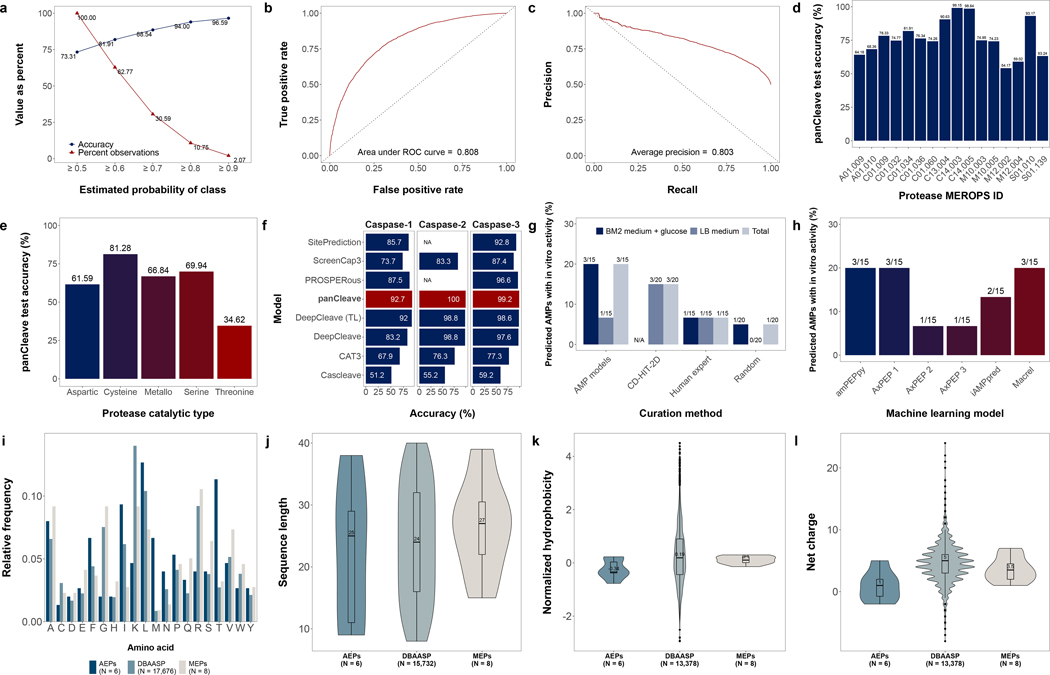
Fig. 2. Model performance and antimicrobial peptide data distributions.
Panels describe panCleave random forest performance evaluation (a-h) and physicochemical distributions for positive hits (i–l). Optimized panCleave random forest performance is reported for independent test data (): (a) accuracy-probability threshold tradeoff curves, comparing accuracy per estimated probability of class membership; (b) the receiver operating characteristic curve; (c) precision-recall curve; (d) panCleave test accuracy for proteases with at least 100 test observations; (e) panCleave test accuracy by protease catalytic type; (f) accuracy of panCleave relative to pre-existing models for three caspases (panCleave in red); (g) positive hit rate by fragment curation method; and (h) positive hit rate by antimicrobial activity classifier. Panels i–l compare amino acid frequency (i), fragment length (j), normalized hydrophobicity (k), and net charge distributions (l) for MEPs, AEPs, and AMPs reported in DBAASP41. Hydrophobicity scores employ the Eisenberg and Weiss scale30. Note that DBAASP data were restricted to fragments of length 8–40 residues for length, hydrophobicity, and charge distributions, with null values excluded. DBAASP amino acid frequencies were computed by excluding noncanonical residues.

