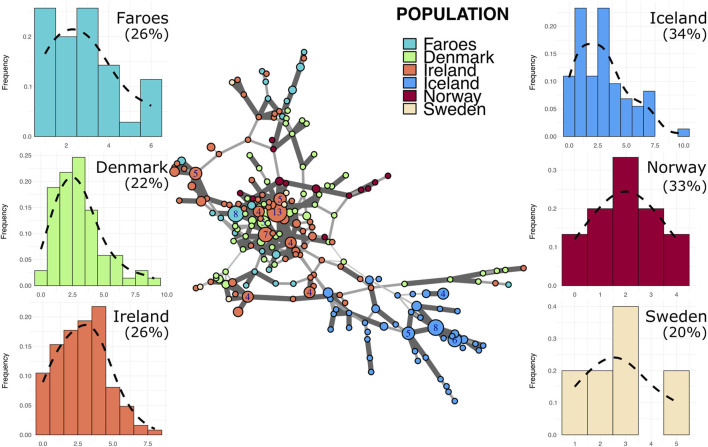
FIGURE 3.
Minimum spanning network and mutational distance histograms of all R1b individuals. Minimum spanning network in the center of figure represents all haplotypes assigned to haplogroup R1b across all populations in this study. Color of node indicates source population while size of node represents the number of individuals assigned to that node. Larger nodes have numbers representing the exact number of individuals for that node. Thickness and opacity of lines connecting nodes correspond to the number of mutational changes (Hamming distance) between connected haplotype nodes where thicker, darker lines indicate fewer changes between nodes. Mutational distance histograms (MDM) for each source population illustrate the mutational distance for each haplotype from a population-specific modal haplotype. Percentages indicate the total proportion of haplotypes within each population that are “neighbor haplotypes”, i.e., haplotypes with only one repeat difference from the modal haplotype.

