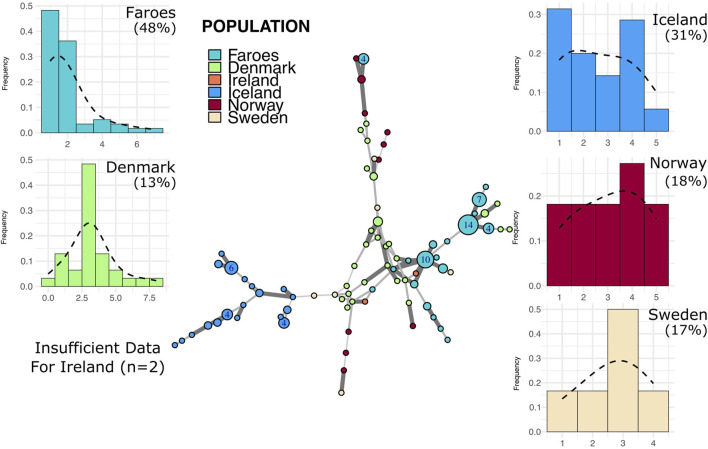
FIGURE 4.
Minimum spanning network and mutational distance histograms of all R1a individuals. Minimum spanning network in the center of figure represents all haplotypes assigned to haplogroup R1a across all populations in this study. See Figure 3 legend for full description of figure interpretation.

