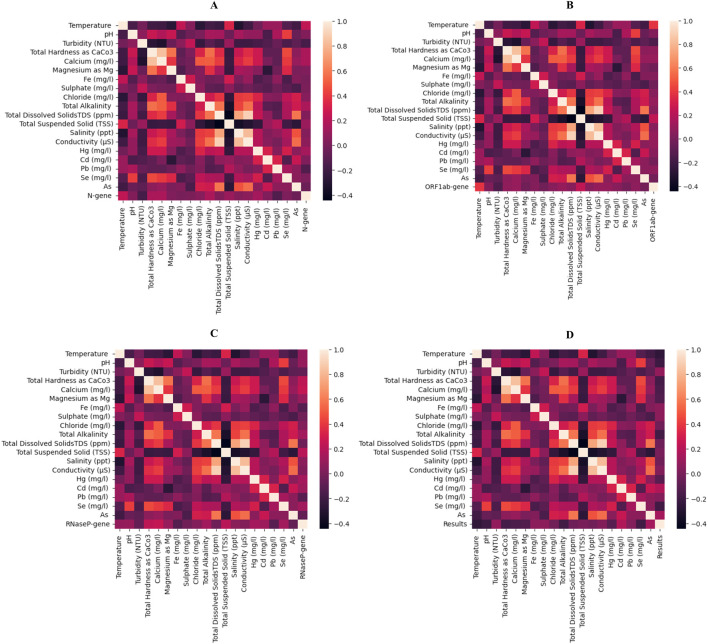
FIGURE 2.
Heatmap represented Spearman’s rank correlation of all the physicochemical properties considered as independent features in this study. The correlation plots are depicted for (A) N gene, (B) ORF1ab gene, (C) RNaseP gene and (D) for RT-qPCR results. The plot showing the presence of both + ve and -ve correlation with the selected features.

