FIGURE 3.

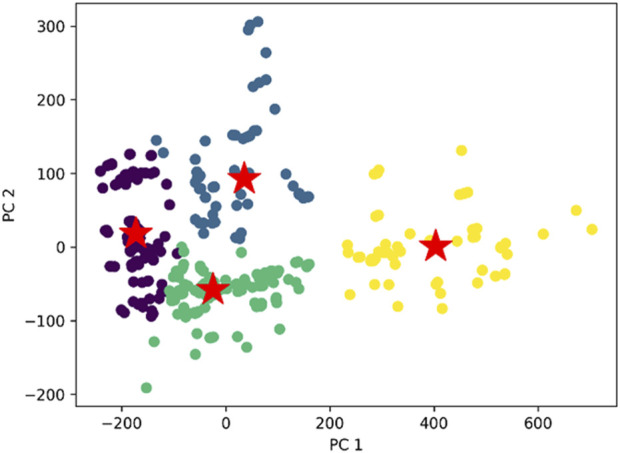
The comprehensive plot of K- means clustering with distinct four clusters and their centroids. The cluster we obtained with respect to the two principal component PC1 and PC2 derived using principal component analysis (PCA).

The comprehensive plot of K- means clustering with distinct four clusters and their centroids. The cluster we obtained with respect to the two principal component PC1 and PC2 derived using principal component analysis (PCA).