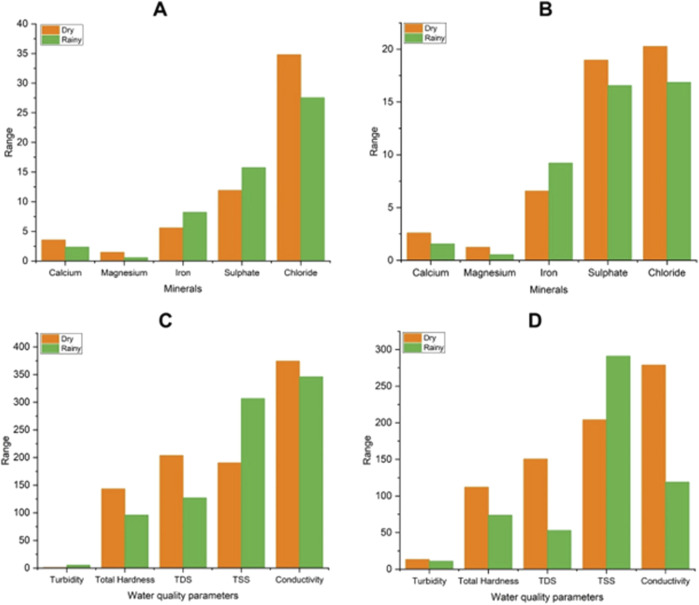
FIGURE 5.
Variation in minerals and water quality parameters with season for changes in clusters. (A) variation in mineral content of sites for cluster change from 0/1 to 2 (B) variation in mineral content of sites for cluster change from 0/1 to 3 (C) variation in water quality parameters of sites for cluster change from 0/1 to 2 and (D) variation in water quality parameters of sites for cluster change from 0/1 to 3.

