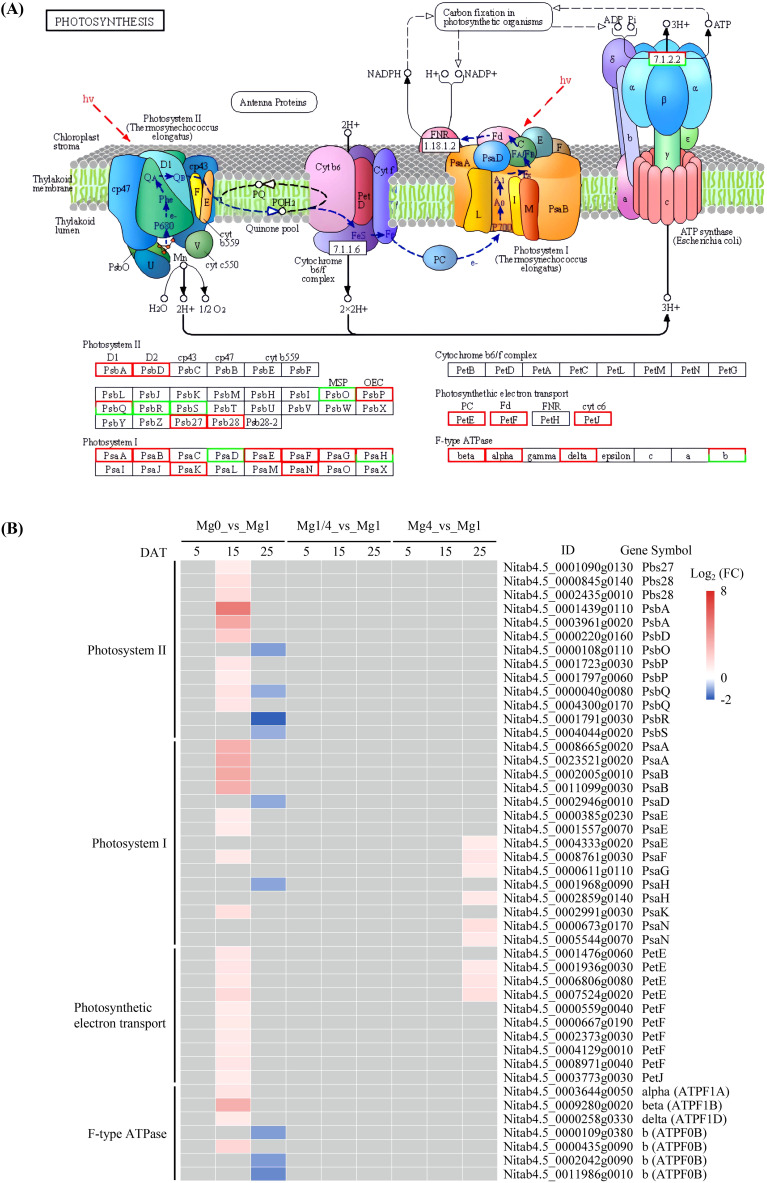
Figure 4.
Expressional changes of KEGG-annotated DEGs in photosynthesis. (A) The KEGG pathway diagram showing DEGs involved in photosynthesis. The expression pattern for each gene is visualized as colors in the boxes containing the gene name. Red and green indicate that the genes were up-regulated and down-regulated, respectively. (B) Heatmap showing the differential expression patterns of DEGs involved in photosynthesis. Grey blocks indicate that the genes were not detected as DEGs by RNA-Seq. Mg0, 0 mM Mg; Mg1/4, 0.50 mM Mg; Mg1, 1.99 mM Mg; Mg4, 7.96 mM Mg. DAT, days after treatment.

