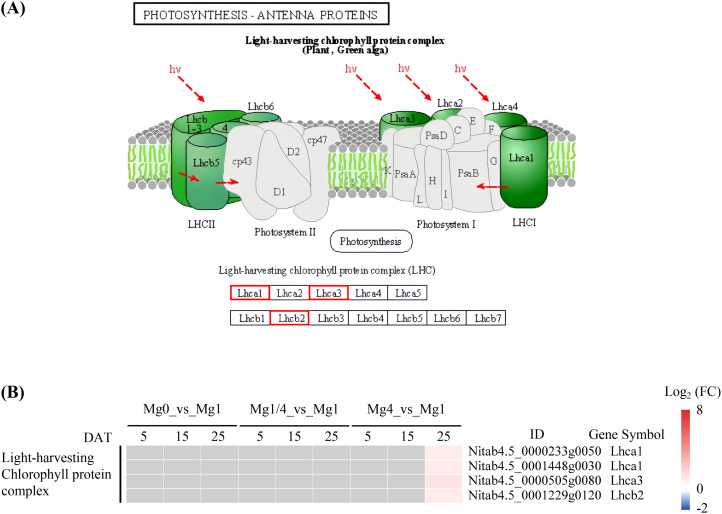
Figure 5.
Expressional changes of KEGG-annotated DEGs in photosynthesis-antenna proteins. (A) The KEGG pathway diagram showing DEGs involved in photosynthesis-antenna proteins. The expression pattern for each gene is visualized as color in the boxes containing the gene name. Red indicates that the genes were up-regulated. (B) Heatmap showing the differential expression patterns of DEGs involved in photosynthesis-antenna proteins. Grey blocks indicate that the genes were not detected as DEGs by RNA-Seq. Mg0, 0 mM Mg; Mg1/4, 0.50 mM Mg; Mg1, 1.99 mM Mg; Mg4, 7.96 mM Mg. DAT, days after treatment.

