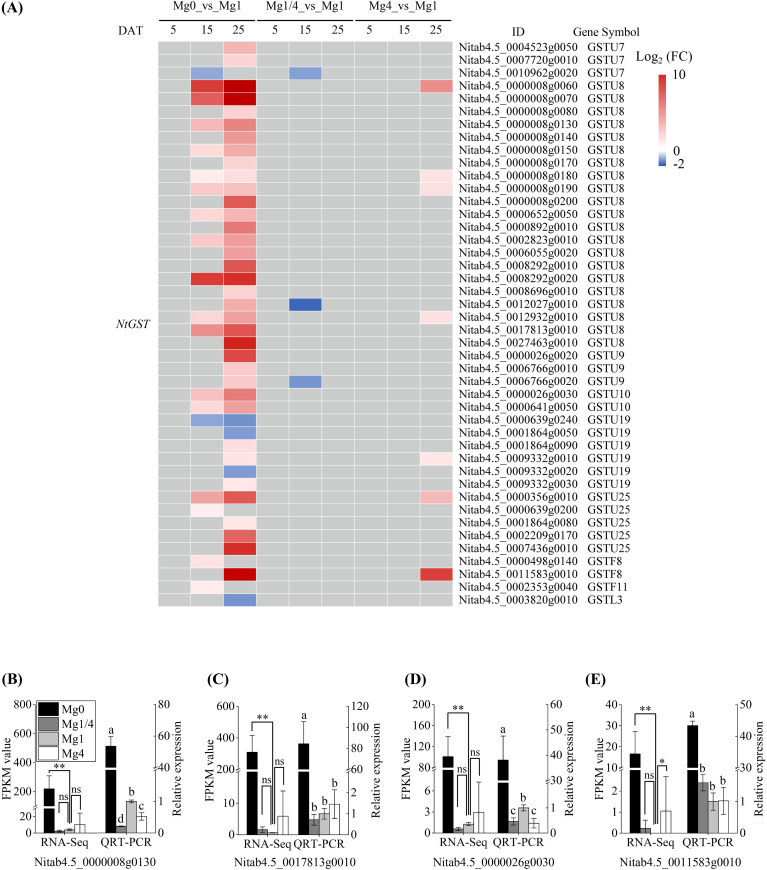
Figure 8.
Expressional changes of glutathione S-transferase (GST) family DEGs. (A) Heatmap showing the differential expression levels of GST family DEGs in leaves of tobacco seedlings grown under different Mg supplies. Grey blocks indicate that the genes were not detected as DEGs by RNA-Seq. (B-E) qRT-PCR validation of four DEGs NtGST8 (Nitab4.5_0000008g0130), NtGST8 (Nitab4.5_0017813g0010), NtGST10 (Nitab4.5_0000026g0030), and NtGSTF8 (Nitab4.5_0011583g0010) in the Mg0, Mg1/4, Mg1, and Mg4 seedlings at 25 DAT. The tobacco EF-1α gene was used as an internal control. DAT, days after treatment. Significance levels *p < 0.05, **p < 0.01, ns, not significant. Different letters (a, b, c, d) above the columns indicate statistical differences (p < 0.05).

