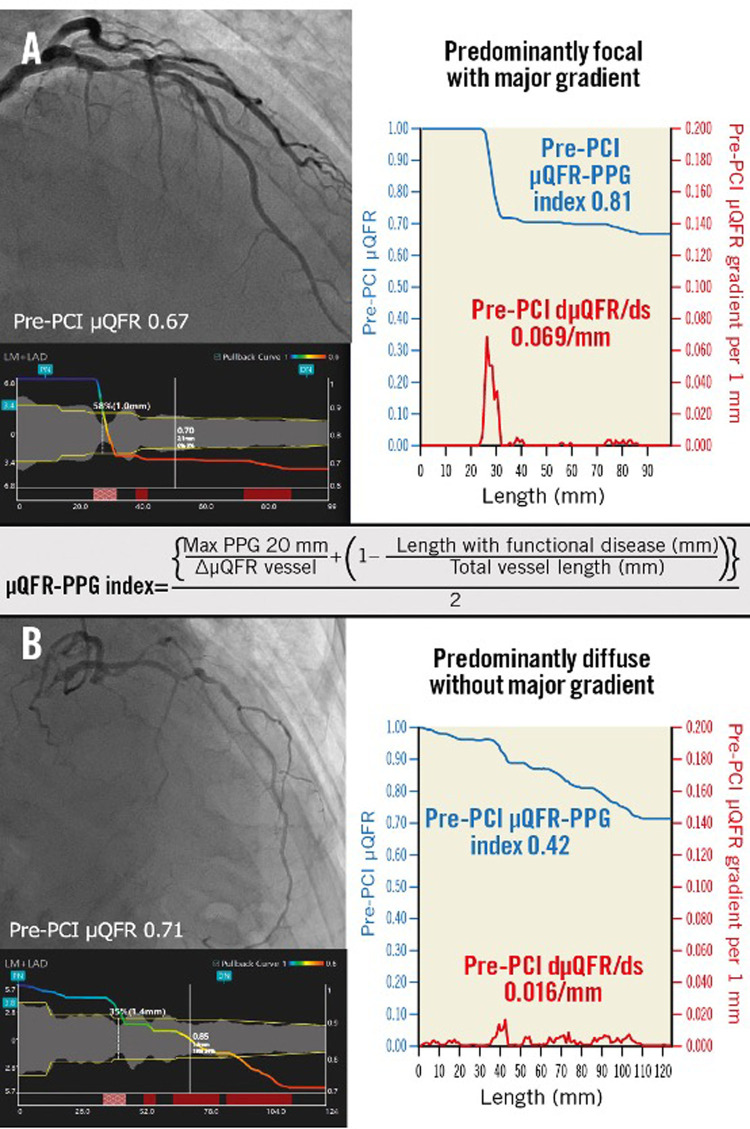
Figure 10.
Pathophysiological CAD patterns assessed by PPG acquired from the pre-PCI angiogram. Red curves in the graphs show pressure drop per 1 mm (dµFR/ds). Cumulative pressure drop is represented as blue curves. (A) The vessel shown has predominantly focal (µFR-PPG ≥0.78) disease with a major gradient (dµFR/ds ≥0.025/mm). (B) The vessel shown has predominantly diffuse disease without a major gradient. In this case, the PPG acquired from the pre-PCI angiogram was 0.42 (<0.78), with the widespread distribution of pressure drop along the target vessel. CAD, coronary artery disease; dµFR/ds, instantaneous µFR ratio gradient per unit length; PCI, percutaneous coronary intervention; PPG, pullback pressure gradient; µFR, Murray law-based quantitative flow ratio [Reproduced from Kotoku et al. (128)].

