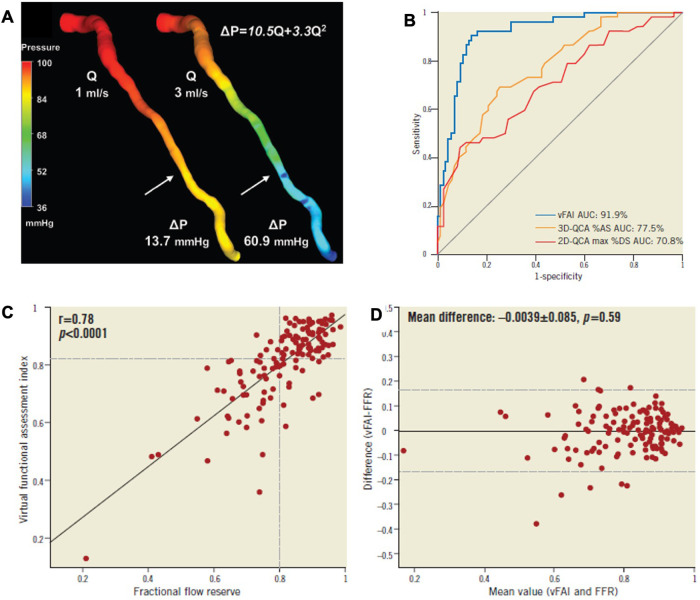
Figure 7.
Functional assessment of intermediate coronary lesions using quantitative coronary angiography. (A) 3D-QCA of an LAD artery with a moderate lesion (arrow: maximal stenosis) in angiography [3D-QCA %diameter stenosis (%DS): 35%] that had a low fractional flow reserve (FFR = 0.64) measured at a distal location (dotted arrow) using the pressure wire coronary lumen reconstruction with the pressure distribution in a color-coded map for two different flow rates (Q), which resulted in a pressure gradient (ΔP) of 13.7 and 60.9 mmHg. The computed artery-specific ΔP-Q relationship is provided. The arrows denote the location of maximal stenosis. (B) The AUC was 91.9% (95% CI: 86%–96%). The respective AUC for 3D-QCA %area stenosis [%AS; AUC: 77.5% (95% CI: 69.9%–84.3%); values on the ROC curve represent 1 − AS) and 2D-QCA max %DS [AUC: 70.8% [95% CI: 62.2%-77.9%]; values on the ROC curve represent 1 − DS) showed that the virtual functional assessment index (vFAI) had significantly higher discriminatory power (p < 0.001 for both). (C,D) Relationship between the ratio of distal to aortic pressure (Pd/Pa) and flow for the studied artery, and calculation of the artery-specific vFAI (0.62) shows the good agreement and correlation with wire-FFR. ROC curve analysis for the vFAI against the fractional flow reserve cut-point (≤0.80: reference standard) [Reproduced from Papafaklis et al. (92)].

