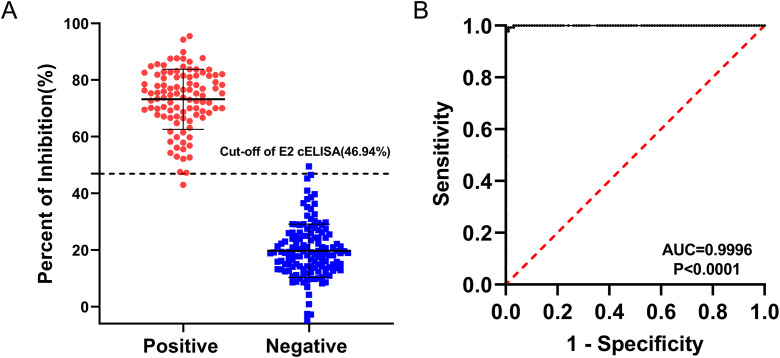
Figure 5.
ROC analysis for the BVDV E2 cELISA. The assay was conducted using BVDV-negative sera (n = 135) and BVDV-positive sera (n = 99). (A) Interactive dot plot diagram displaying the PI values of sera while the cut-off value was set to 46.94%. (B) ROC analysis of cELISA results while the AUC of the test was 0.9996.

