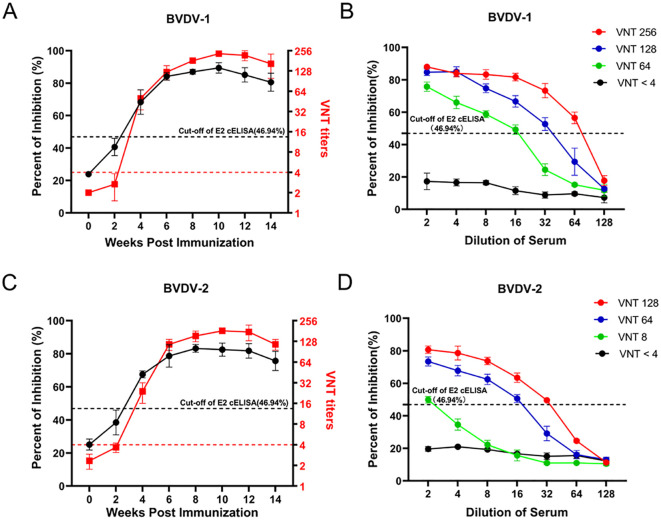
Figure 7.
Detection of the antibody after BVDV immunization in calves using the BVDV E2 cELISA and the VNT. (A) Comparison of the ability of BVDV E2 cELISA and VNT methods in detecting the antibody dynamics after BVDV-1 immunization. The black horizontal dotted line represents the cut-off value of BVDV E2 cELISA and the red horizontal dotted line represents the cut-off value of VNT titers. (B) Detection of the serial dilutions of serum samples against BVDV-1 with different neutralizing titers by the E2 cELISA. The black horizontal dotted line represents the cut-off value. (C) Comparison of the ability of BVDV E2 cELISA and VNT methods in detecting the antibody dynamics after BVDV-2 immunization. The black horizontal dotted line represents the cut-off value of BVDV E2 cELISA and the red horizontal dotted line represents the cut-off value of VNT titers. (D) Detection of the serial dilutions of serum samples against BVDV-2 with different neutralizing titers by BVDV E2 cELISA. The black horizontal dotted line represents the cut-off value.

