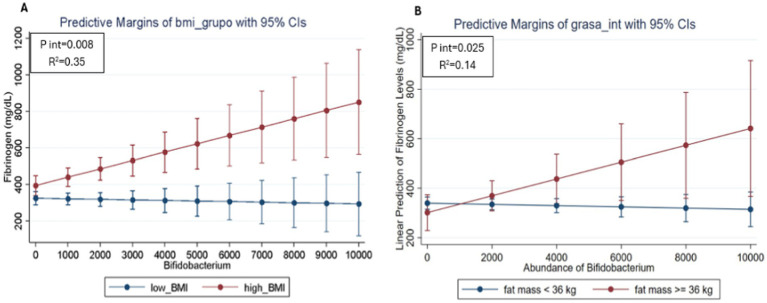
Figure 3.
Predicted values of fibrinogen in SLE participants according to the relative abundance of Bifidobacterium and BMI status (A) and body fat levels (B) using linear regression models adjusted for age and sex. The red line represents participants with high BMI and the blue line represents participants with low BMI. The divergence between the lines suggests how the relative abundance of Bifidobacterium may differentially impact fibrinogen levels depending on BMI and body fat, highlighting the potential role of these factors in inflammation among SLE patients.

