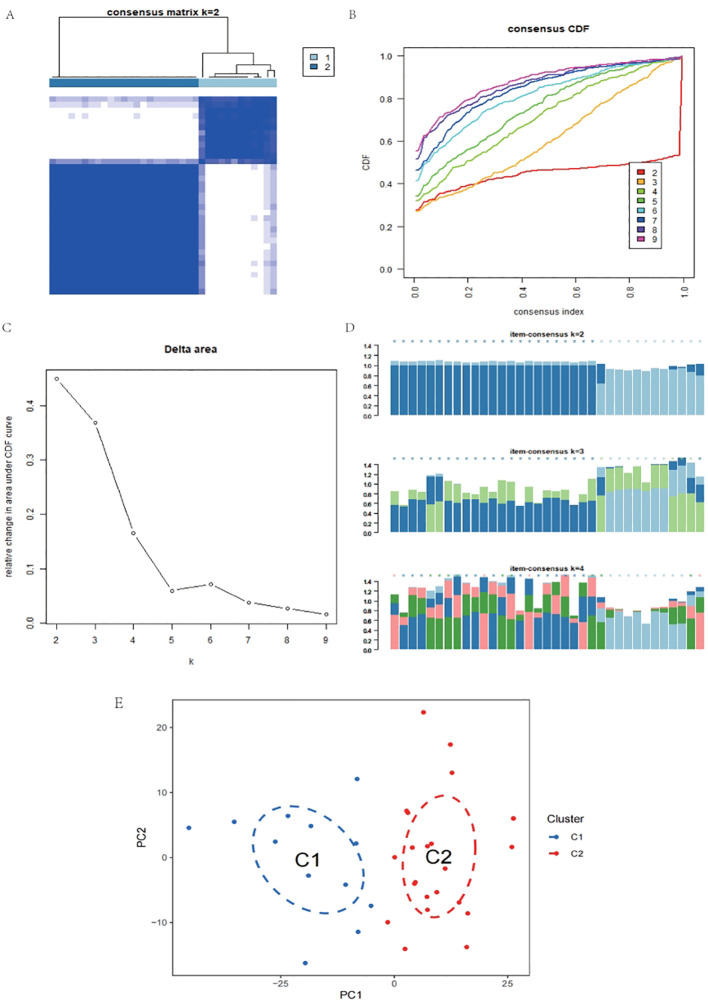
Figure 3.
Consistency cluster analysis and principal component analysis. (A) When consensus matrix k=2, the samples were divided into two modules. (B, C) When consensus matrix k=2, the internal consistency performed best. (D) When consensus matrix k=2, consensus scores of all samples were displayed. (E) Principal component analysis indicated that when consensus matrix k=2, the samples can be well distinguished.

